





fig5
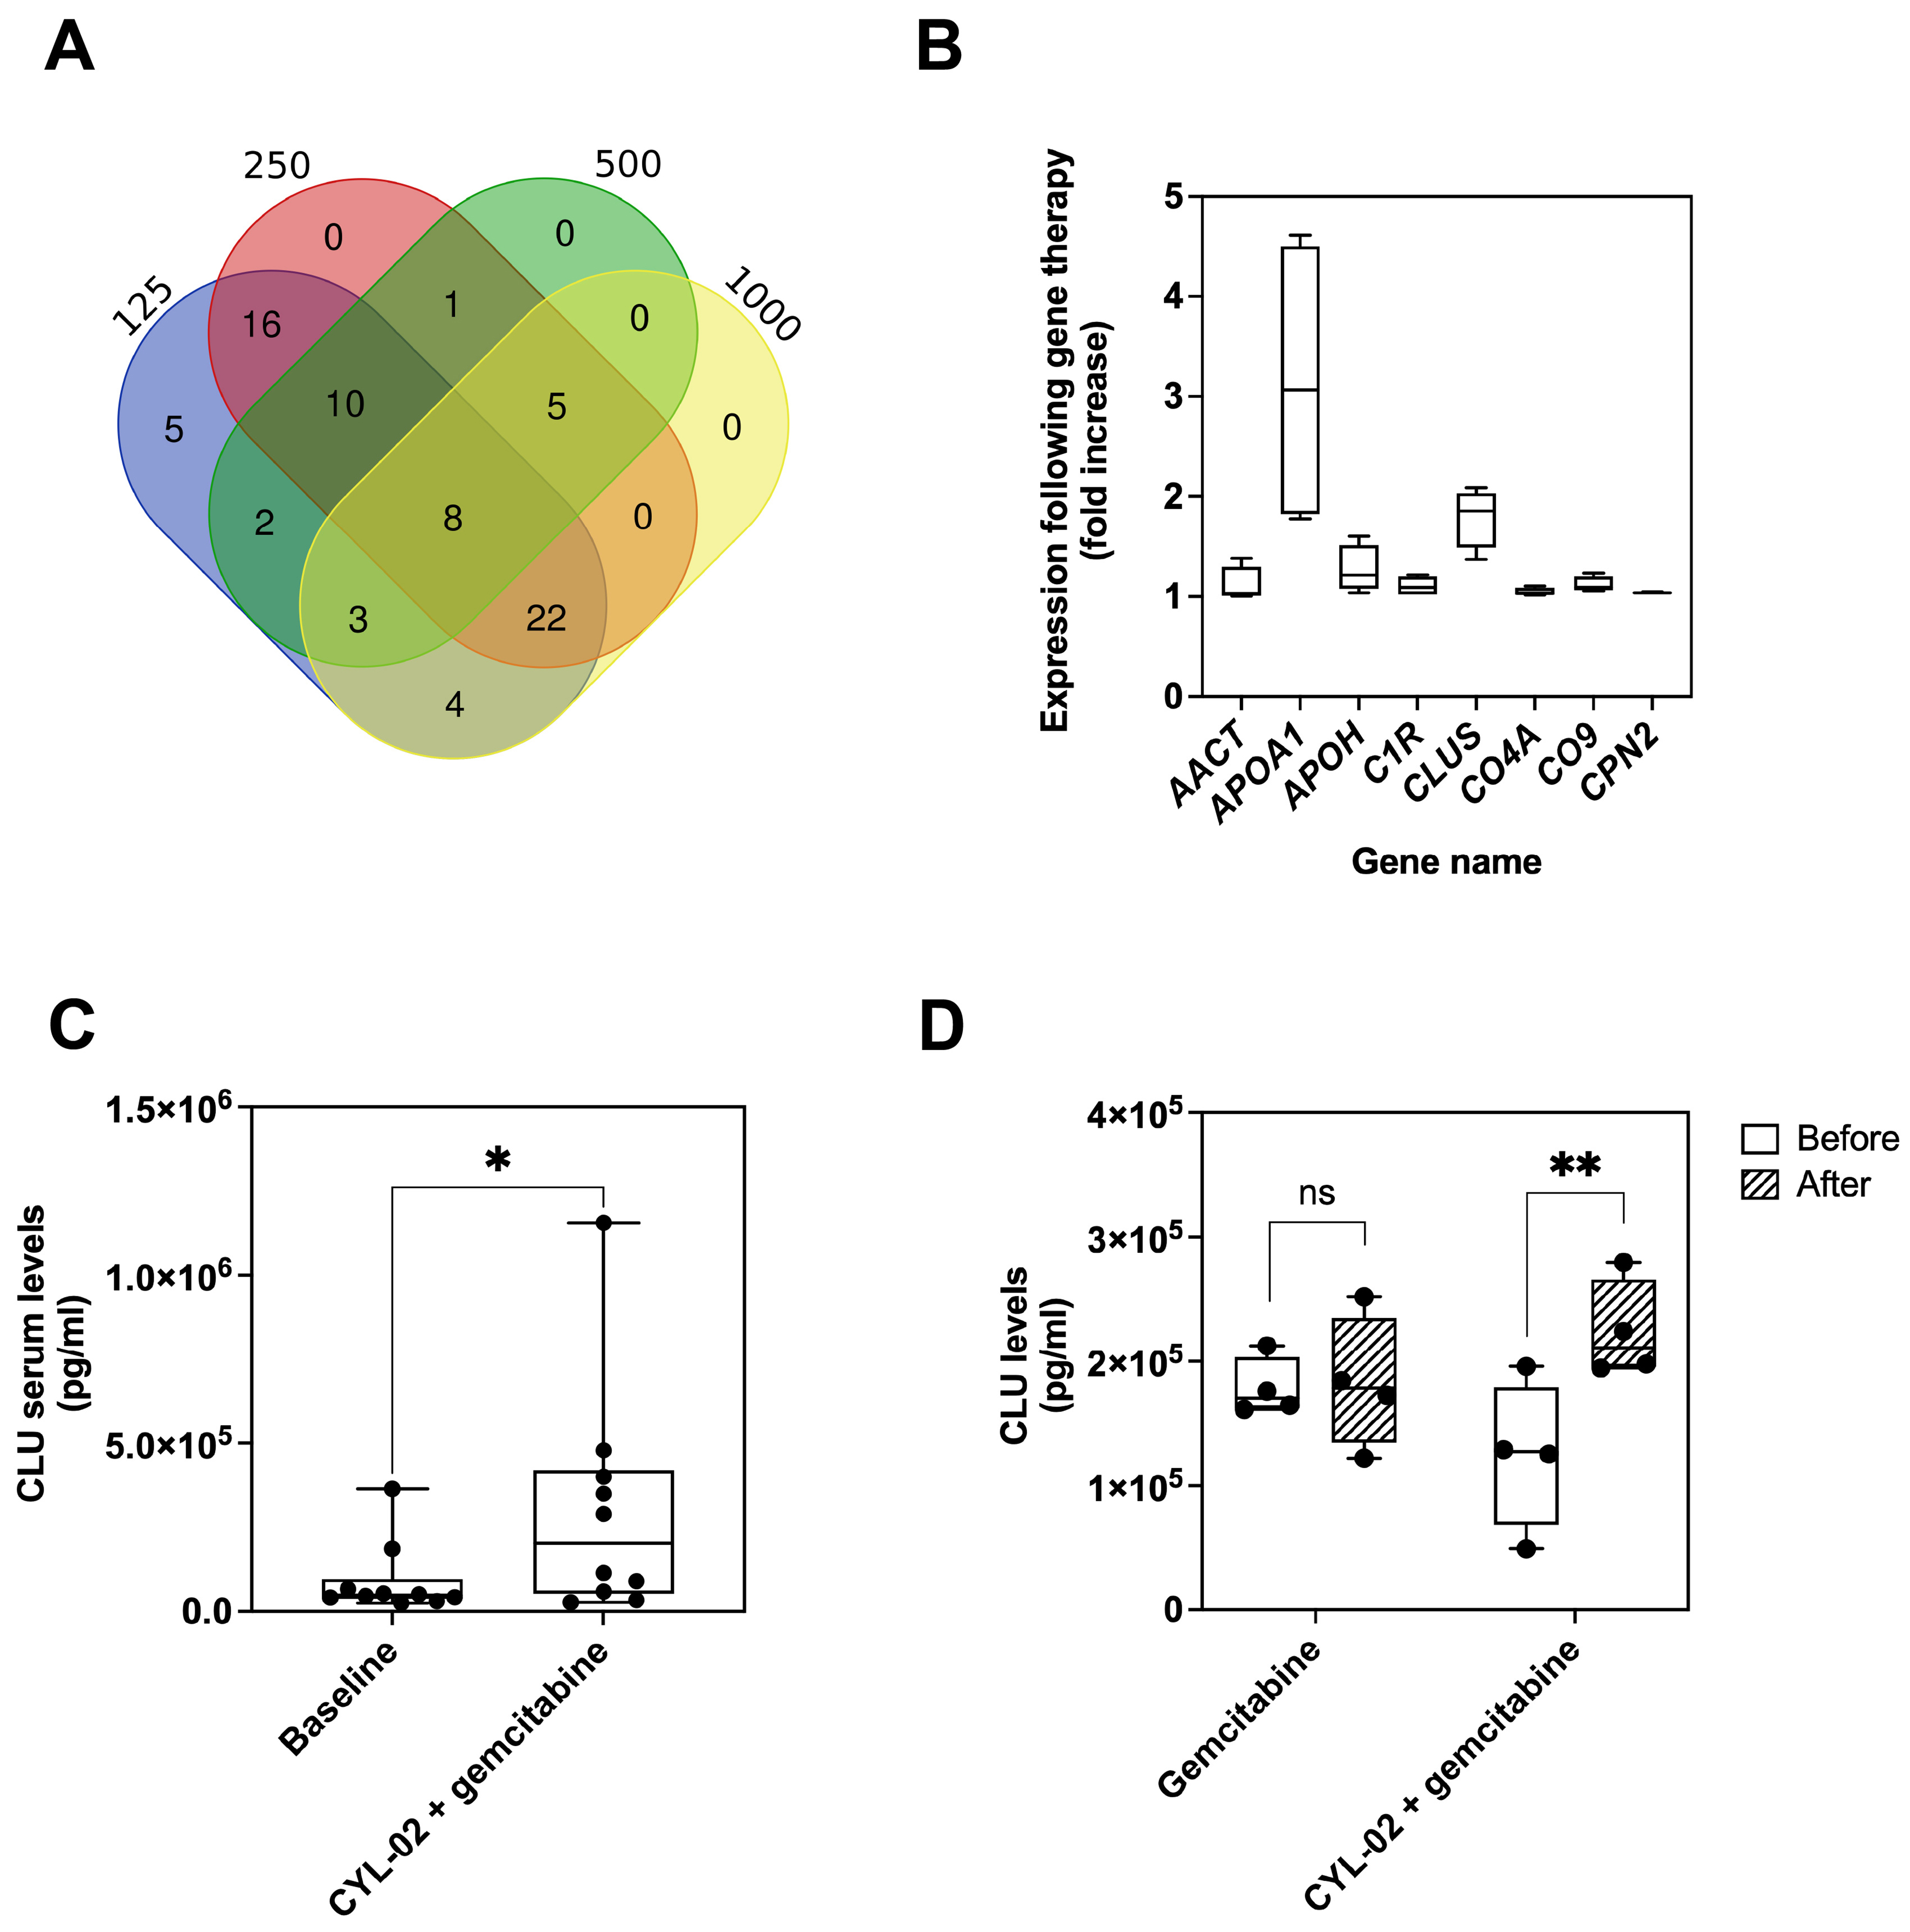
Figure 5. Plasma protein profiling and CLU quantification in Thergap trials. (A) Venn diagram of CHIP-MS/MS profiling of plasma proteins from PDAC patients enrolled in the Thergap-1 trial, at the indicated therapeutic DNA doses; (B) Change in plasma levels of proteins upregulated by CYL-02 + gemcitabine treatment during the Thergap-1 clinical trial. Data are presented as minimum to maximum values (n = 24 patients); (C) Analysis of CLU expression by ELISA in the plasma of Thergap-1 patients (n = 10), comparing baseline levels and 28 days post-treatment. Data are presented as minimum to maximum values. Statistical analysis was conducted using a paired t-test; (D) Analysis of CLU expression by ELISA before and after 2 weeks of treatment in patients enrolled in the Thergap-2 clinical trial (n = 4). Data are presented as minimum to maximum values. Statistical analysis was conducted using a Mann-Whitney test. *P < 0.05, **P < 0.01, ns, not significant. CLU: Clusterin; CHIP-MS/MS: microfluidic chip mass spectrometry/tandem mass spectrometry; PDAC: pancreatic ductal adenocarcinoma; ELISA: enzyme-linked immunosorbent assay.