


fig2
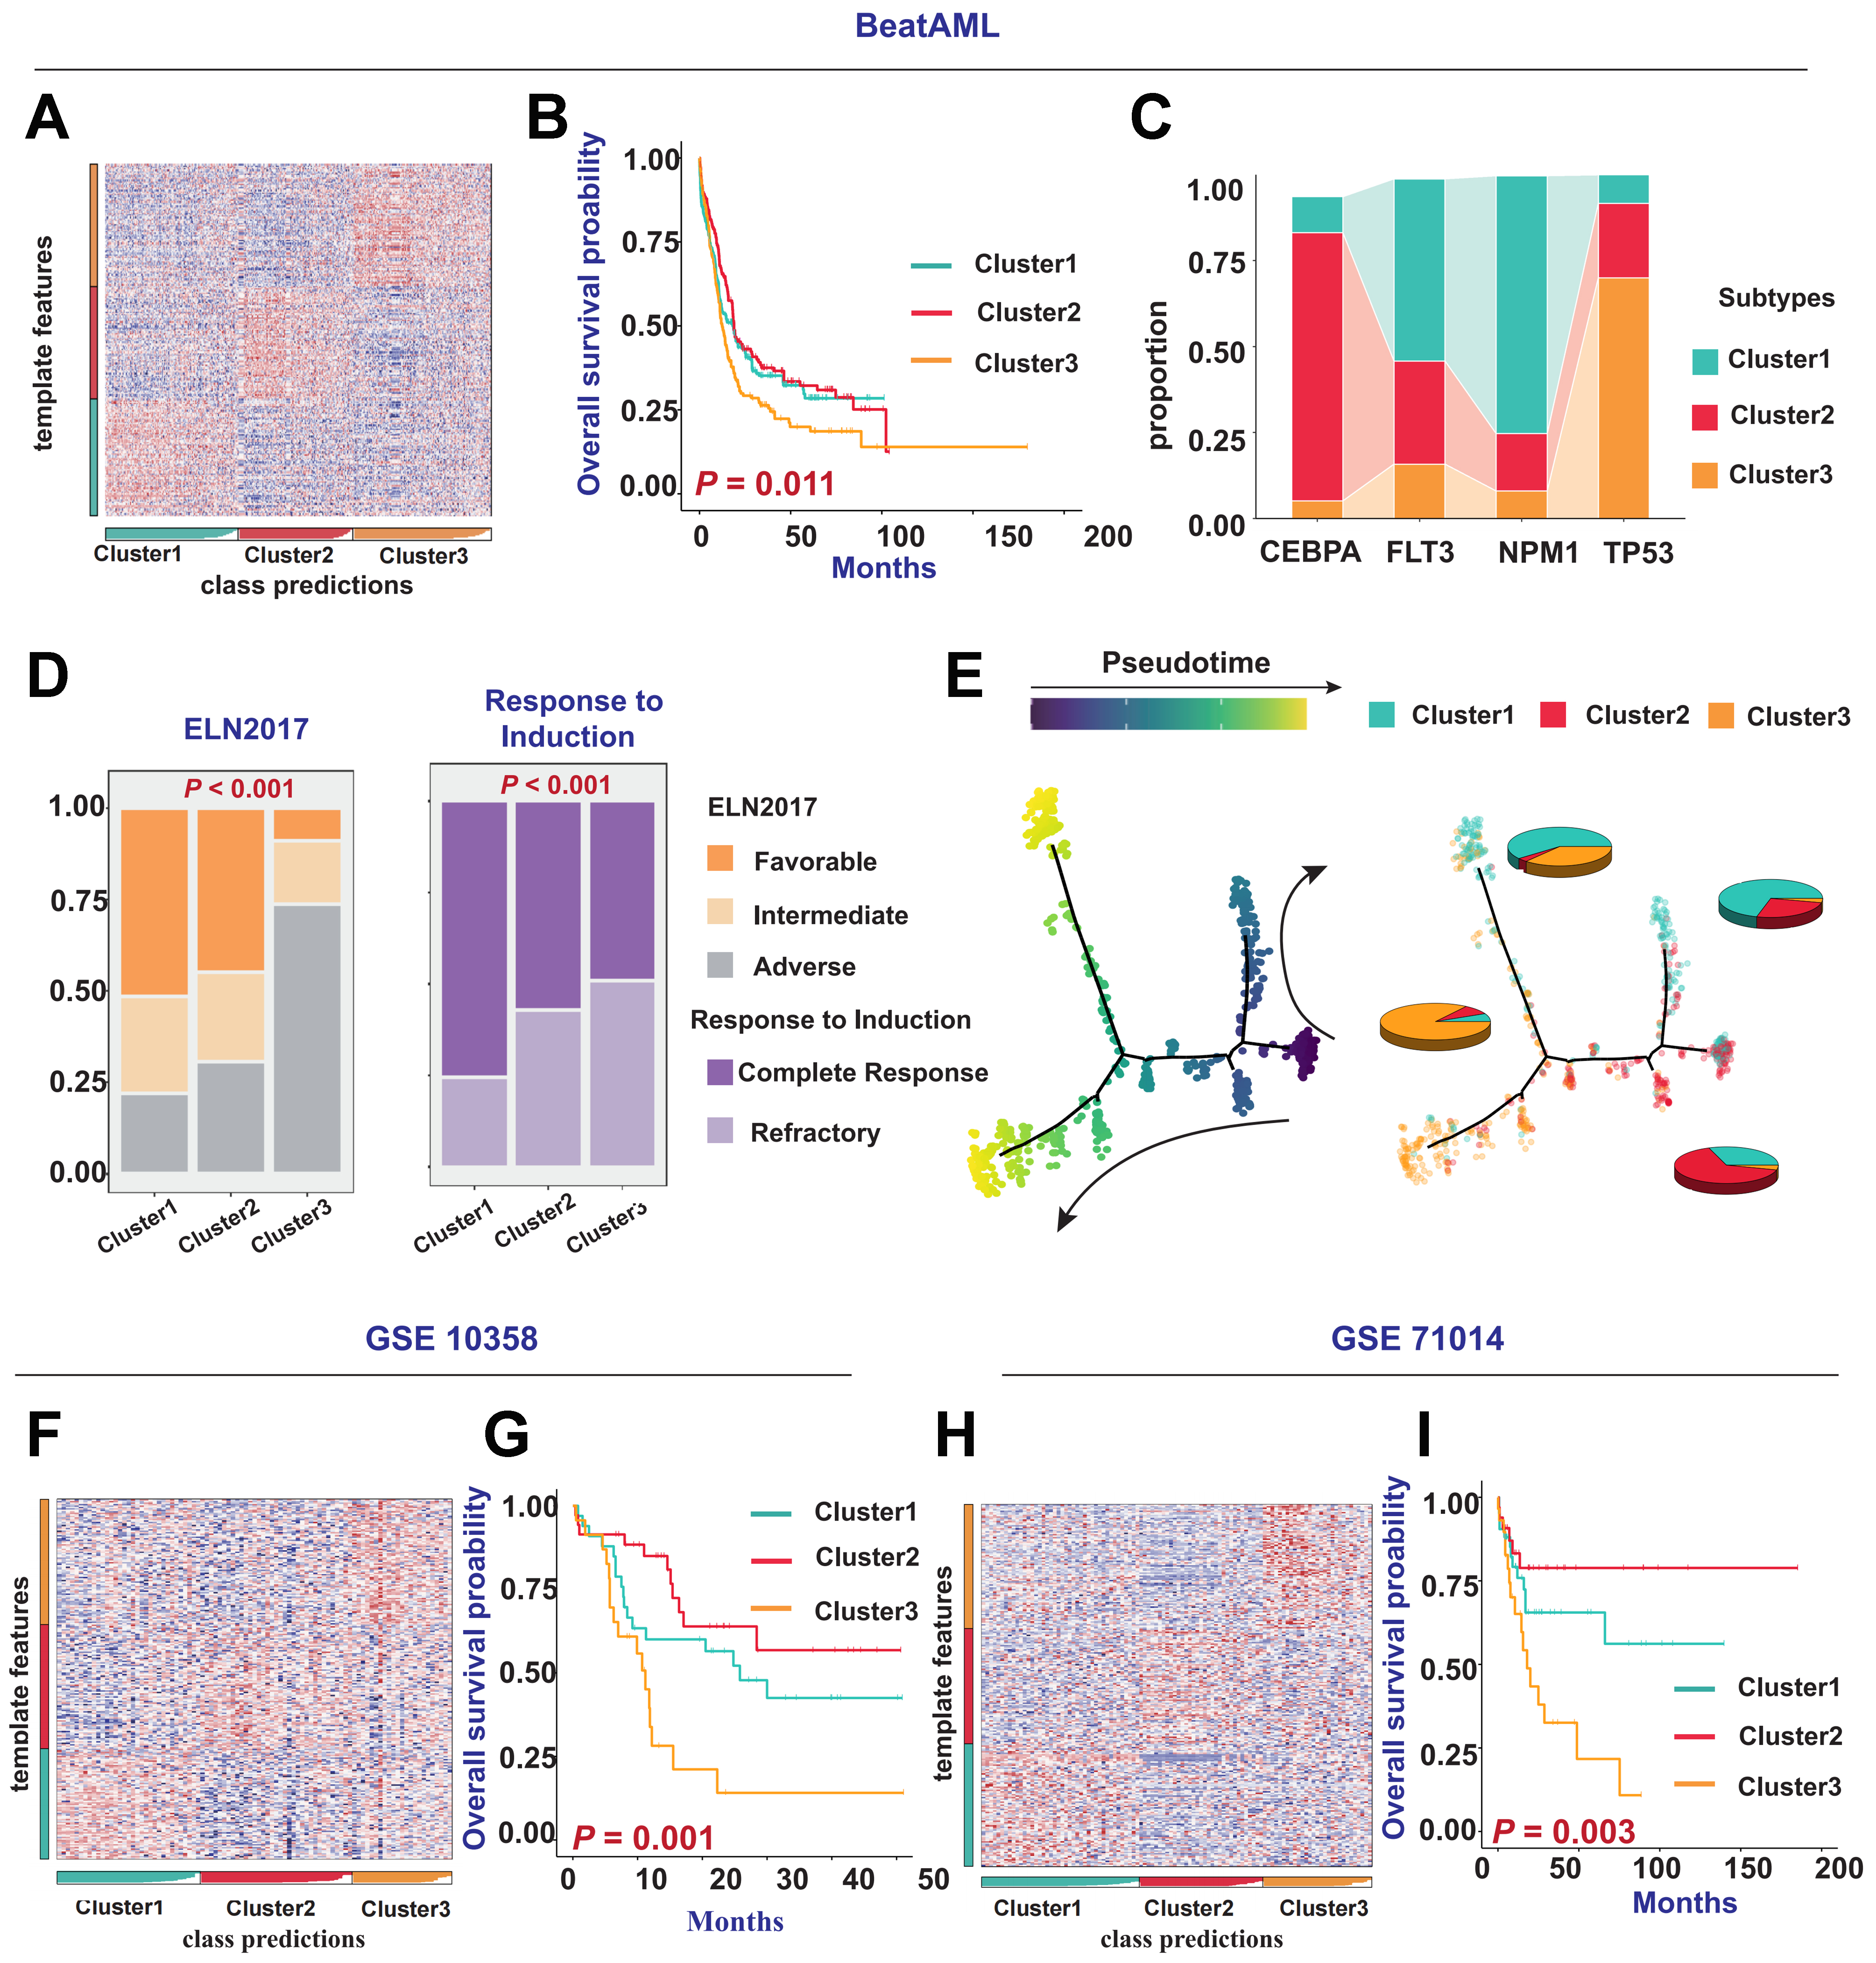
Figure 2. Reproduction of AML molecular subtyping results in external cohorts. (A) Prediction and classification of patient samples using NTP in the BEAT AML cohort; (B) Kaplan-Meier survival curves illustrating differences in OS among patients with different clusters in the BEAT AML cohort (P = 0.011); (C) Comparison of CEBPA, FLT3, NPM1, and TP53 gene mutations with the three clusters; (D) Bar chart describing the relationship between clinical indicators such as ELN 2017 risk categories, patient responses to induction therapy and the three clusters in the BEAT AML cohort; (E) Simulation of patient differentiation trajectories in different clusters within the BEAT AML cohort; (F and H) Prediction and classification of patient samples using NTP in the GSE10358 and GSE71014 cohorts; (G and I) Kaplan-Meier survival curves showing differences in OS among patients with different subtypes in the GSE10358 cohort (P = 0.001) and GSE71014 cohort (P = 0.003). Log-rank tests were used to calculate P-values for Kaplan-Meier survival curves, and categorical variables were analyzed using the chi-square test or Fisher’s exact test. AML: Acute myeloid leukemia; NTP: nearest template prediction; OS: overall survival; CEBPA: CCAAT/enhancer-binding protein alpha; FLT3: FMS-like tyrosine kinase 3; NPM1: nucleophosmin 1; TP53: tumor protein 53; ELN: European LeukemiaNet.


