


fig1
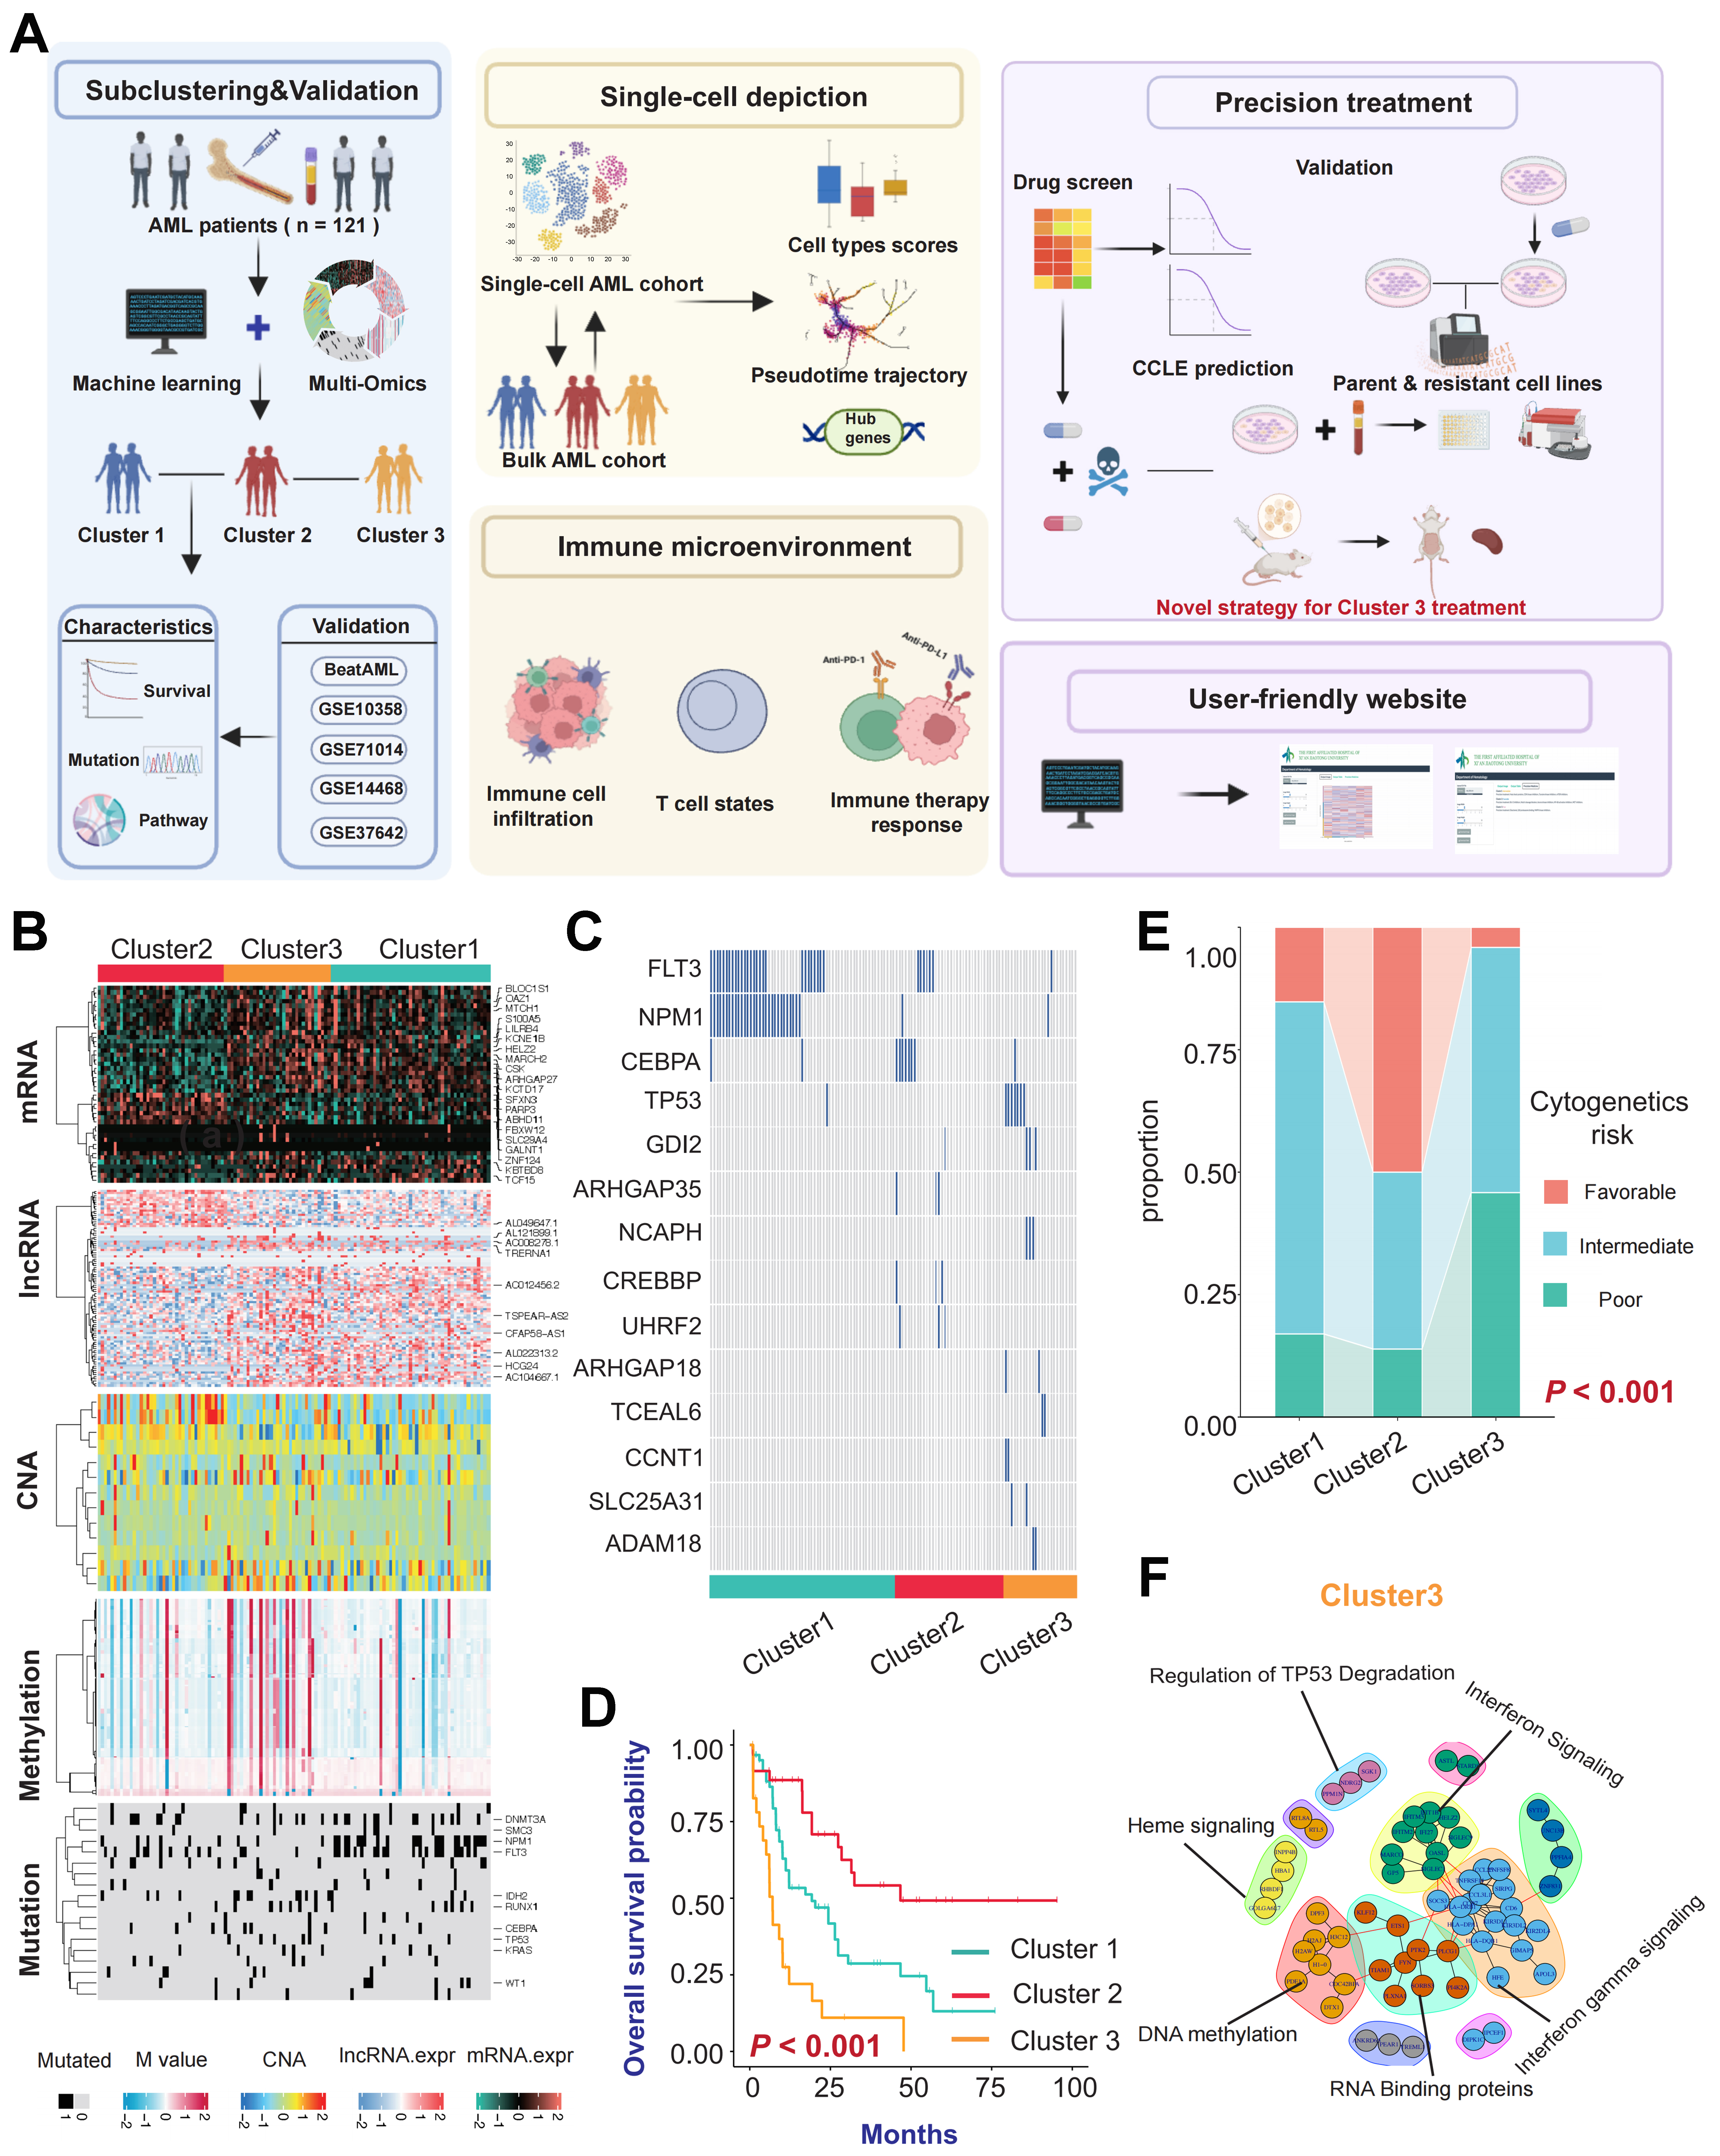
Figure 1. Identification of three distinct clusters and evaluation of different clinical indicators. (A) Workflow of this study; (B) Heatmap of multi-omics characteristics for the three subtypes; (C) Differences in gene mutation frequencies among the three clusters; (D) Kaplan-Meier survival curves illustrate differences in OS among patients with different clusters (P < 0.001); (E) Comparison of the existing AML cytogenetic risk standards with the three subtypes identified through clustering in this study; (F) PPI network interactions of upregulated differential genes in Cluster 3, showing enriched pathways for different gene modules. Log-rank tests were used to calculate P-values for Kaplan-Meier survival curves, and categorical variables were analyzed using the chi-square test or Fisher’s exact test. The color scheme is maintained throughout the study where turquoise represents Cluster 1, red represents Cluster 2, and yellow represents Cluster 3. Created in BioRender. Yang, R. (2026) https://BioRender.com/w0nln0a. OS: Overall survival; AML: acute myeloid leukemia; PPI: protein-protein interaction; PD-1: programmed cell death protein 1; PD-L1: programmed cell death ligand 1; CCLE: Cancer Cell Line Encyclopedia; mRNA: messenger RNA; lncRNA: long non-coding RNA; CNA: copy number alteration; TP53: tumor protein 53.


