




fig3
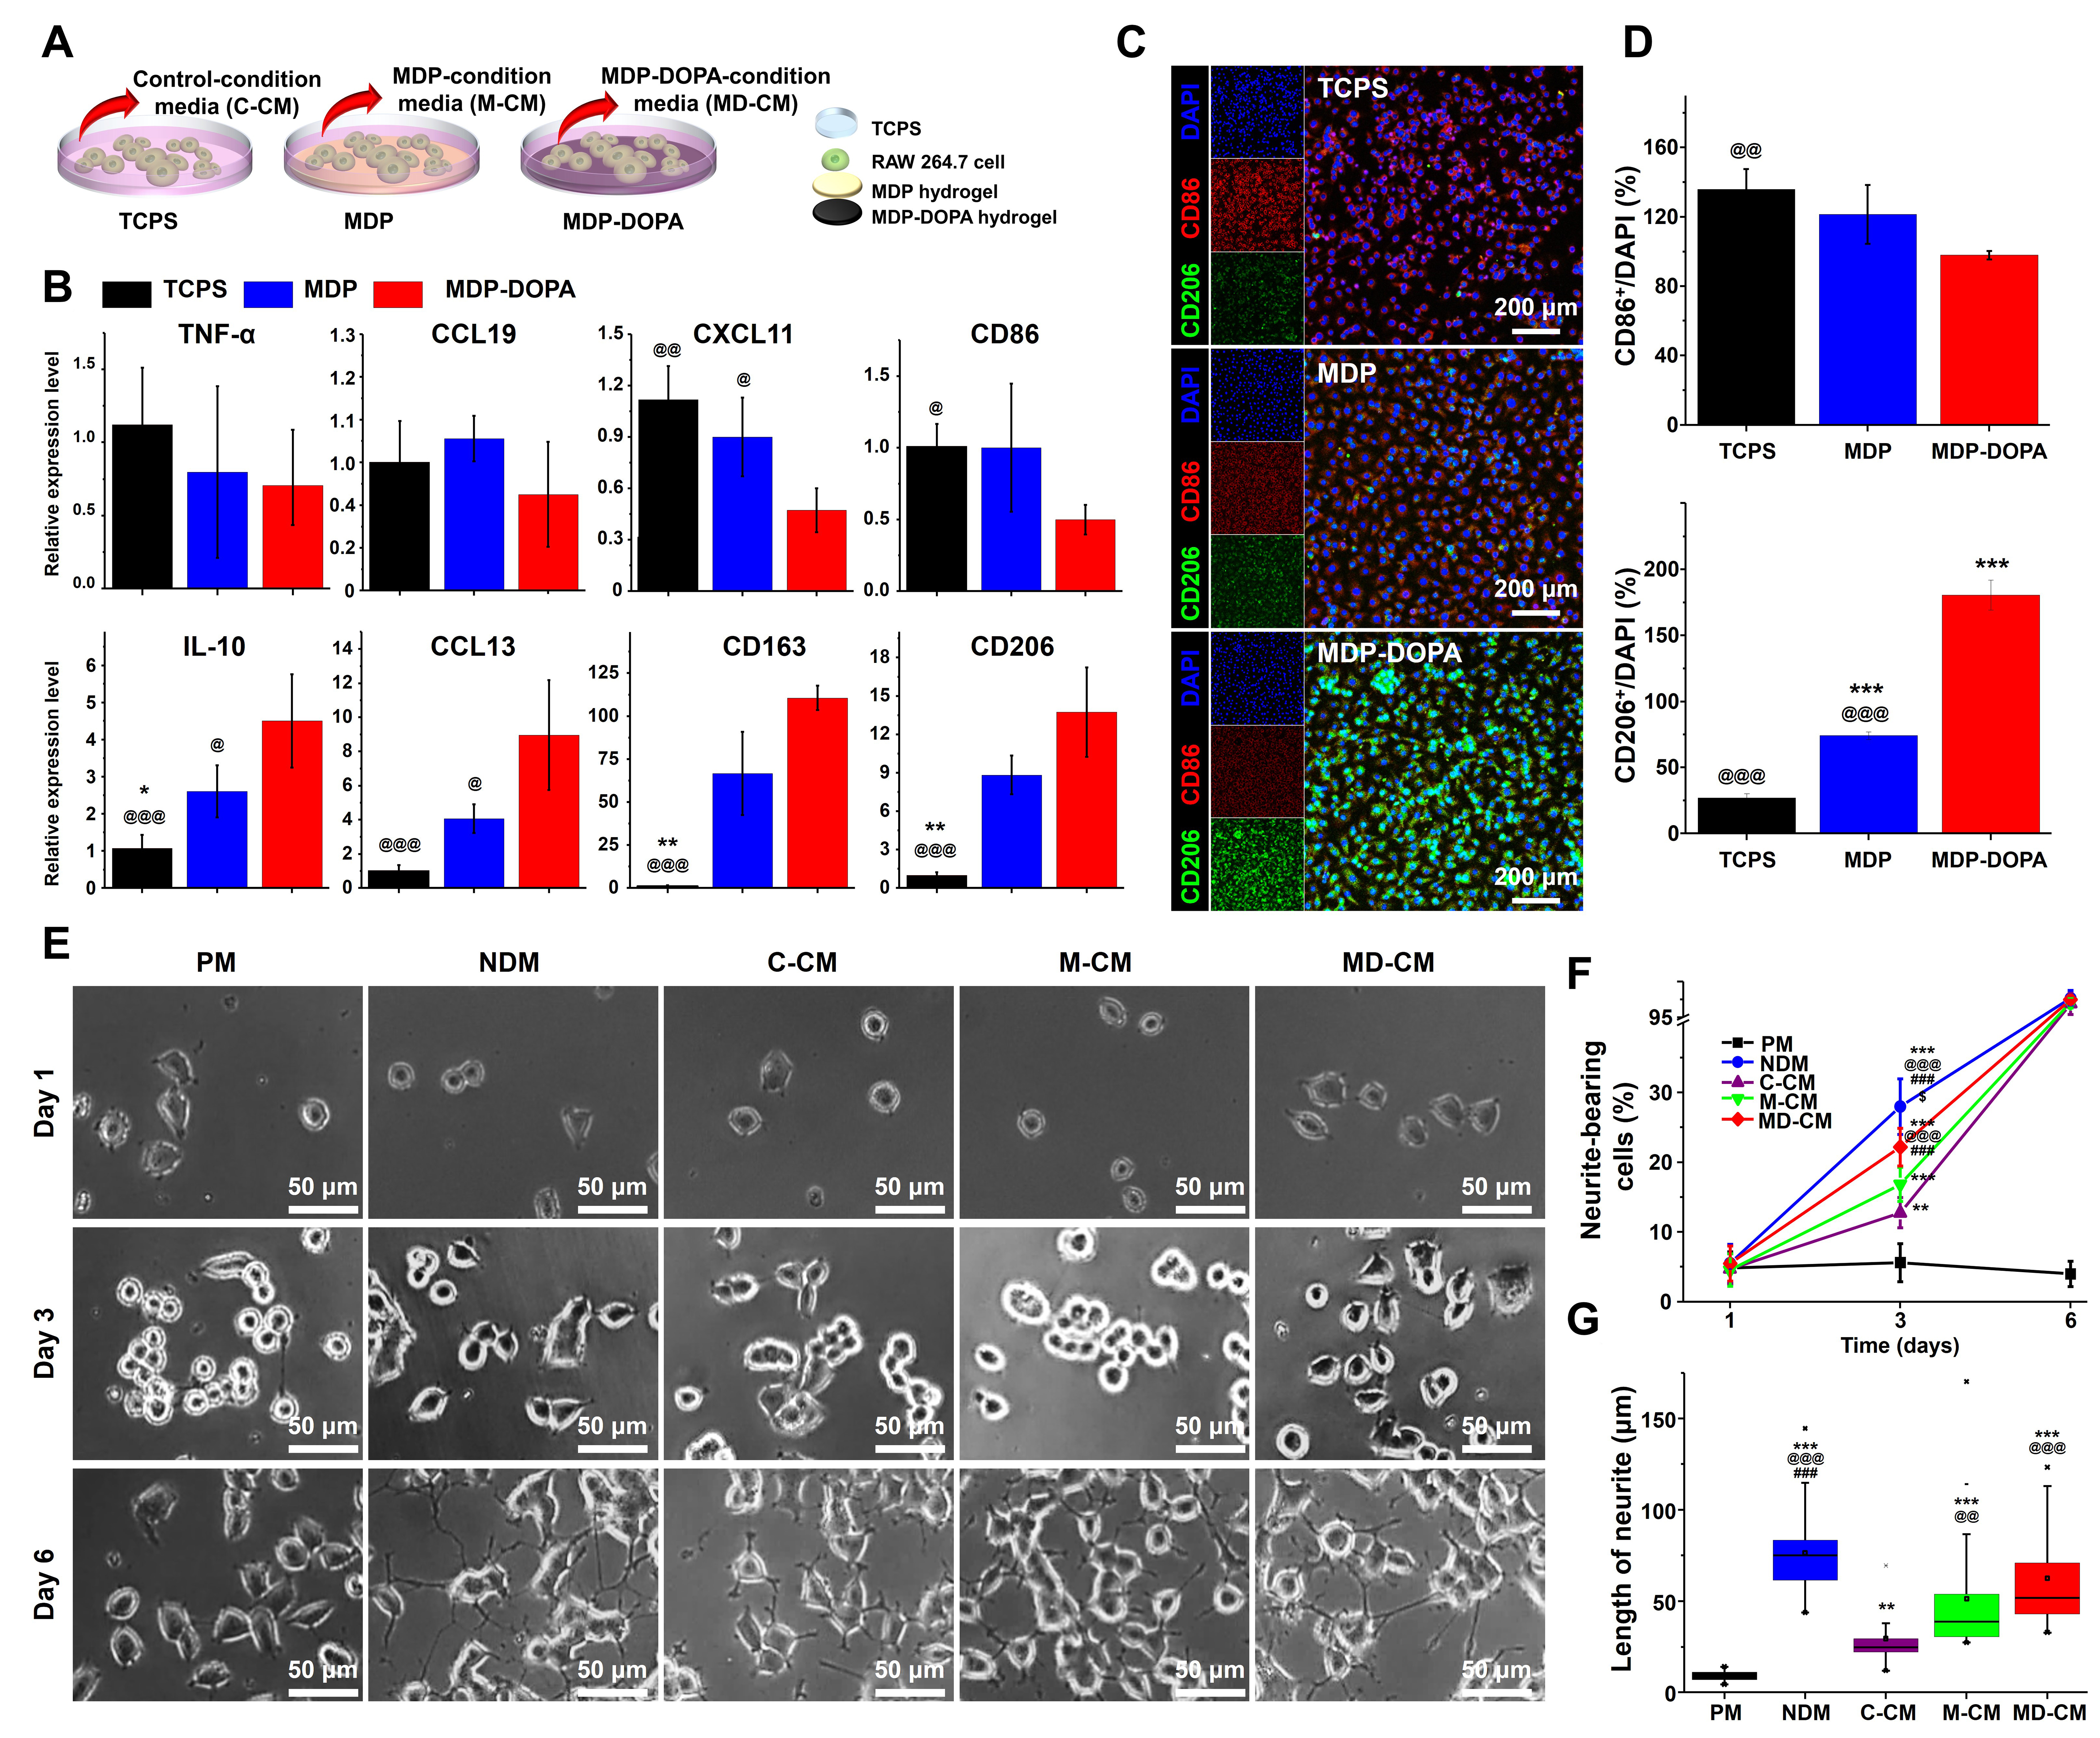
Figure 3. (A) Schematic illustration of collecting various CM; (B) Examination of M1/M2 macrophage phenotype-related markers. (*P < 0.05 and **P < 0.01 vs. MDP; @P < 0.05,@@P < 0.01, and @@@P < 0.001 vs. MDP-DOPA); (C) Confocal micrographs and (D) corresponding quantitative analysis of M1 (CD86) and M2 (CD206) phenotypic markers in cultured macrophages. (***P < 0.001 vs. TCPS, @@P < 0.01 and @@@P < 0.001 vs. MDP-DOPA), (Scale bar = 200 μm); (E) Representative phase-contrast microscopic images showing differentiated PC12 cells cultured in various CM (Scale bar = 50 μm); (F) Proportion of cells with neurites, and (G) neurite lengths for each sample (**P < 0.01 and ***P < 0.001 vs. PM, @@P < 0.01 and @@@P < 0.001 vs. C-CM, ###P < 0.001 vs. M-CM, $P < 0.05 vs. MD-CM). In (G), data are presented as a box-and-whisker plot, where the center line represents the median, the box boundaries indicate the 25th and 75th percentiles (IQR), the whiskers denote 1.5 × IQR, and individual outlier points are shown as markers. For all other quantitative panels (B, D, and F), values represent the mean ± SD derived from four biological replicates (n = 4). CM: Conditioned media; MDP: milk-derived protein; DOPA: dihydroxyphenylalanine; TCPS: tissue culture polystyrene; PM: proliferation media; C-CM: TCPS conditioned media; M-CM: MDP conditioned media; MD-CM: MDP-DOPA conditioned media; IQR: interquartile range; SD: standard deviation; DAPI: 4′,6-diamidino-2-phenylindole; NDM: neuronal differentiation media.





