


fig3
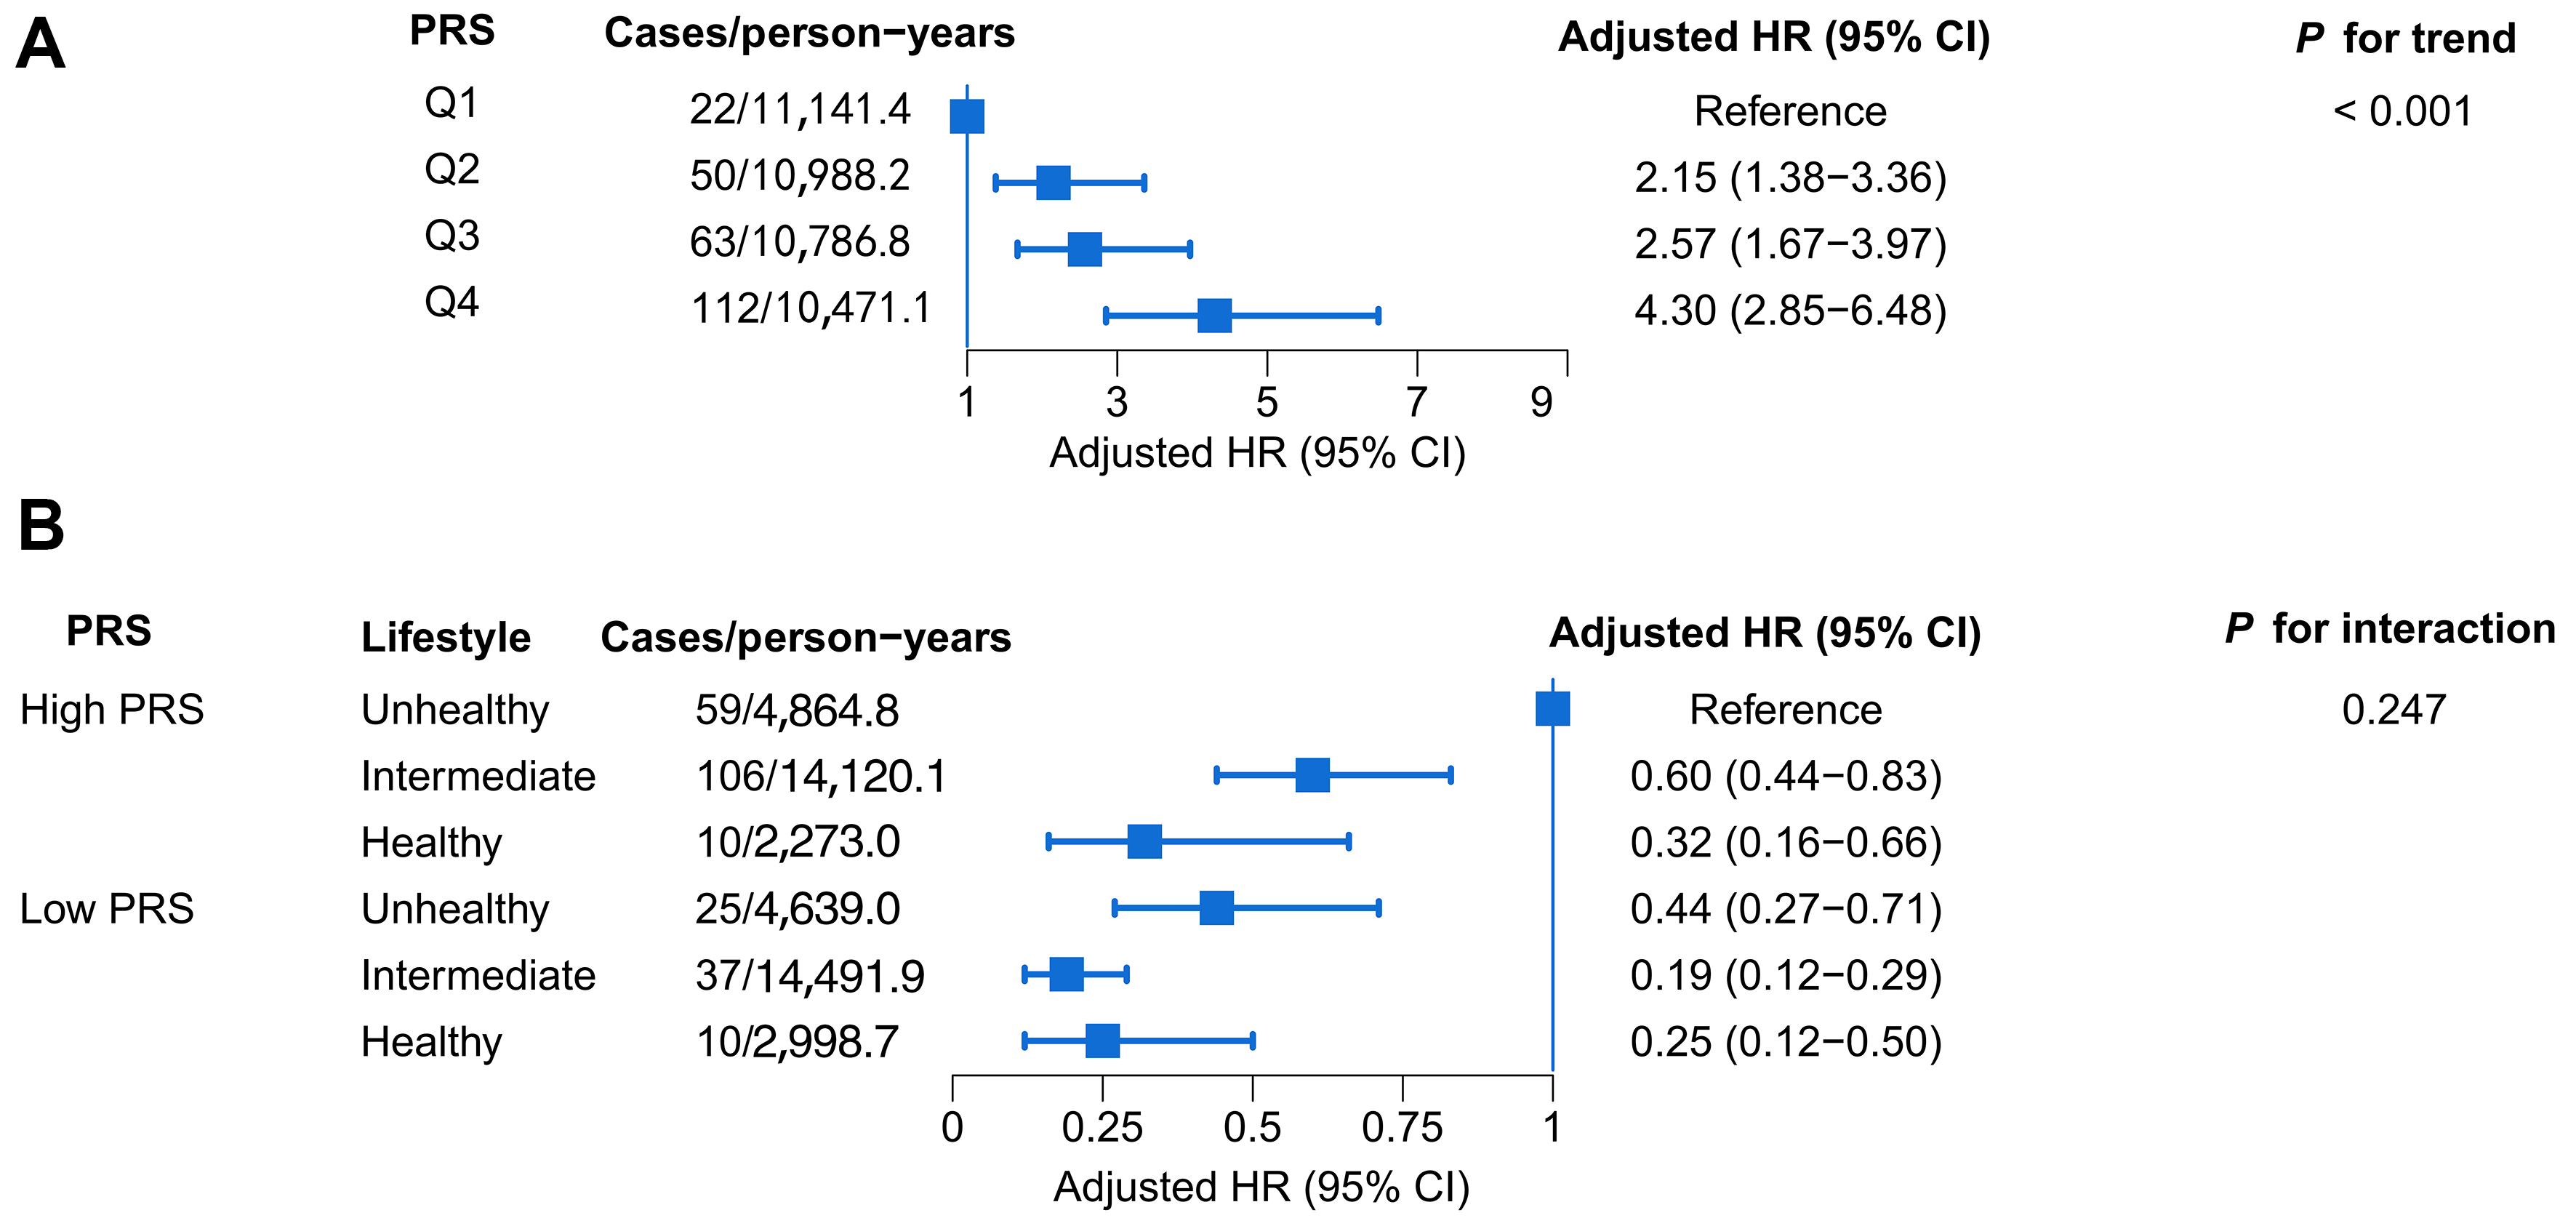
Figure 3. Independent effect of PRS and its combined effect with the lifestyle score on T2DM. (A) Independent effect of the PRS on T2DM risk. Participants were categorized into quartiles (Q1-Q4) based on the PRS, with Q1 serving as the reference group. The forest plot presents adjusted HRs and 95%CIs for each quartile. All models were adjusted for age, race/ethnicity, education level, parity, oral contraceptive use, family history of diabetes, and individual lifestyle factors (BMI, diet, physical activity, sleep, alcohol consumption, and smoking); (B) Combined effect of the PRS and lifestyle on T2DM risk. The PRS was collapsed into low genetic risk (Q1-Q2) and high genetic risk (Q3-Q4). A combined lifestyle score (range 0-6) was constructed from six healthy behaviors and classified as unhealthy (0-1 points), intermediate (2-3 points), or healthy (4-6 points). Cross-classification of genetic risk and lifestyle categories generated six joint groups. The forest plot presents HRs and 95%CIs, with the high genetic risk/unhealthy lifestyle group as the reference. Analyses were adjusted for age, race/ethnicity, education level, parity, oral contraceptive use, and family history of diabetes. The P value for interaction was derived from an interaction term between genetic risk categories and lifestyle categories. BMI: Body mass index; CI: confidence interval; HR: hazard ratio; PRS: polygenic risk score; Q1: quartile 1; Q2: quartile 2; Q3: quartile 3; Q4: quartile 4; T2DM: type 2 diabetes mellitus.





