




fig2
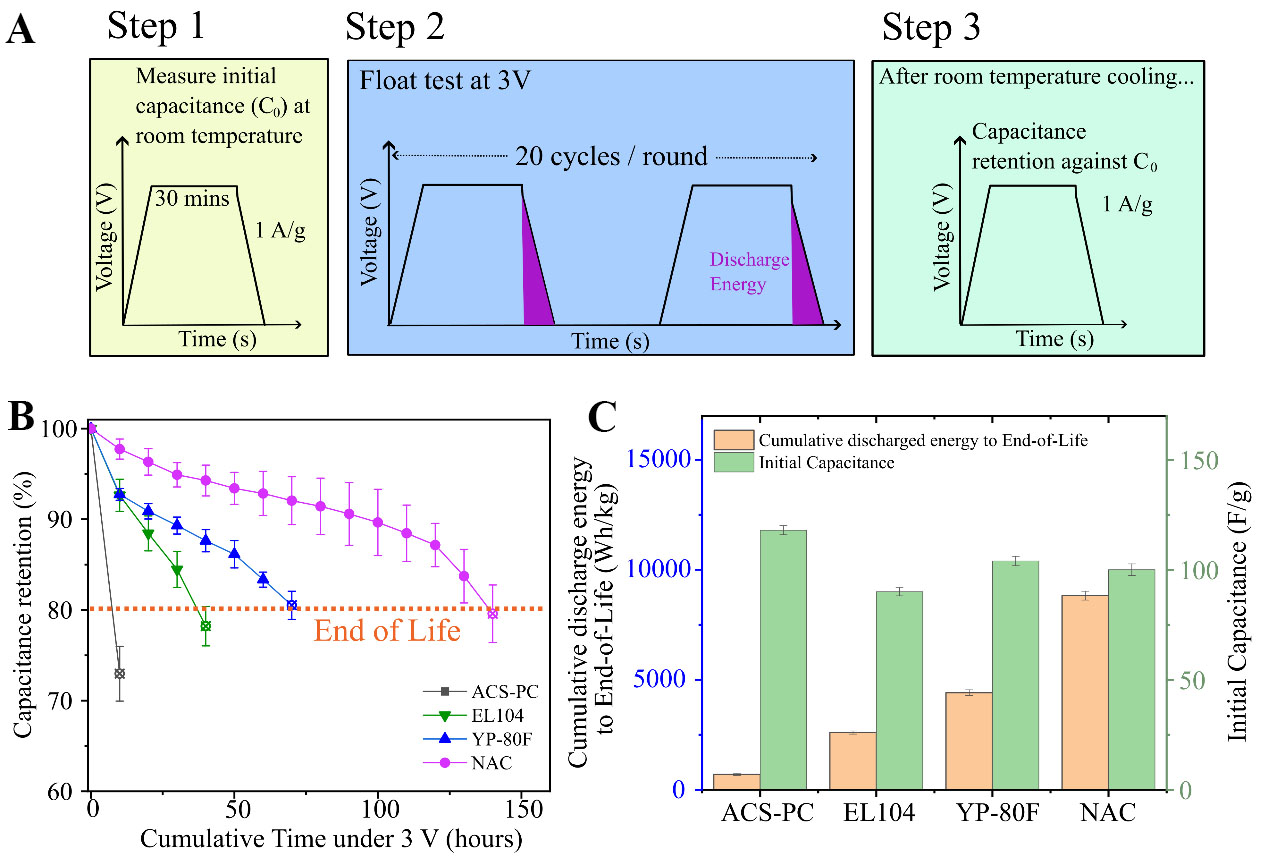
Figure 2. Accelerated electrochemical stress test protocol and its impact on capacitance retention and cumulative energy delivery. (A) Schematic for accelerated stress tests under 70 °C, involving a 30-min potentiostatic period (also known as a ‘float test’) at 3 V per cycle. The area under the discharge curve, including the IR Drop, was used to compute the discharge energy for each cycle; (B) Capacitance retention curves obtained in 10-h intervals, at room temperature. End-of-Life was determined based on losing approximately 20% of initial capacitance (dashed horizontal line). For each carbon, the performance of three individual cells can be found in Supplementary Materials, under Supplementary Tables 4-7. Error bars represent one standard deviation. NAC’s capacitance trend exhibited a gentle decay slope up until 120 h before decay accelerates. In contrast, YP-80F’s capacitance decay started to accelerate after 50 h; (C) Comparison of cumulative discharged energy up to End-of-Life alongside the initial capacitances of each carbon, measured at 3 V. Although ACS-PC exhibited superior initial capacitance, its rapid failure rate in comparison to those of carbons with developed mesoporosity highlights a trade-off between expanding theoretical capacitive limits and compromising throughput. The error bars represent one standard deviation, derived from the performance of three individual cells per carbon. NAC: Nanoporous amorphous carbon.





