




fig8
From: Residual stress mapping of additively manufactured Inconel 718 via synchrotron X-ray diffraction
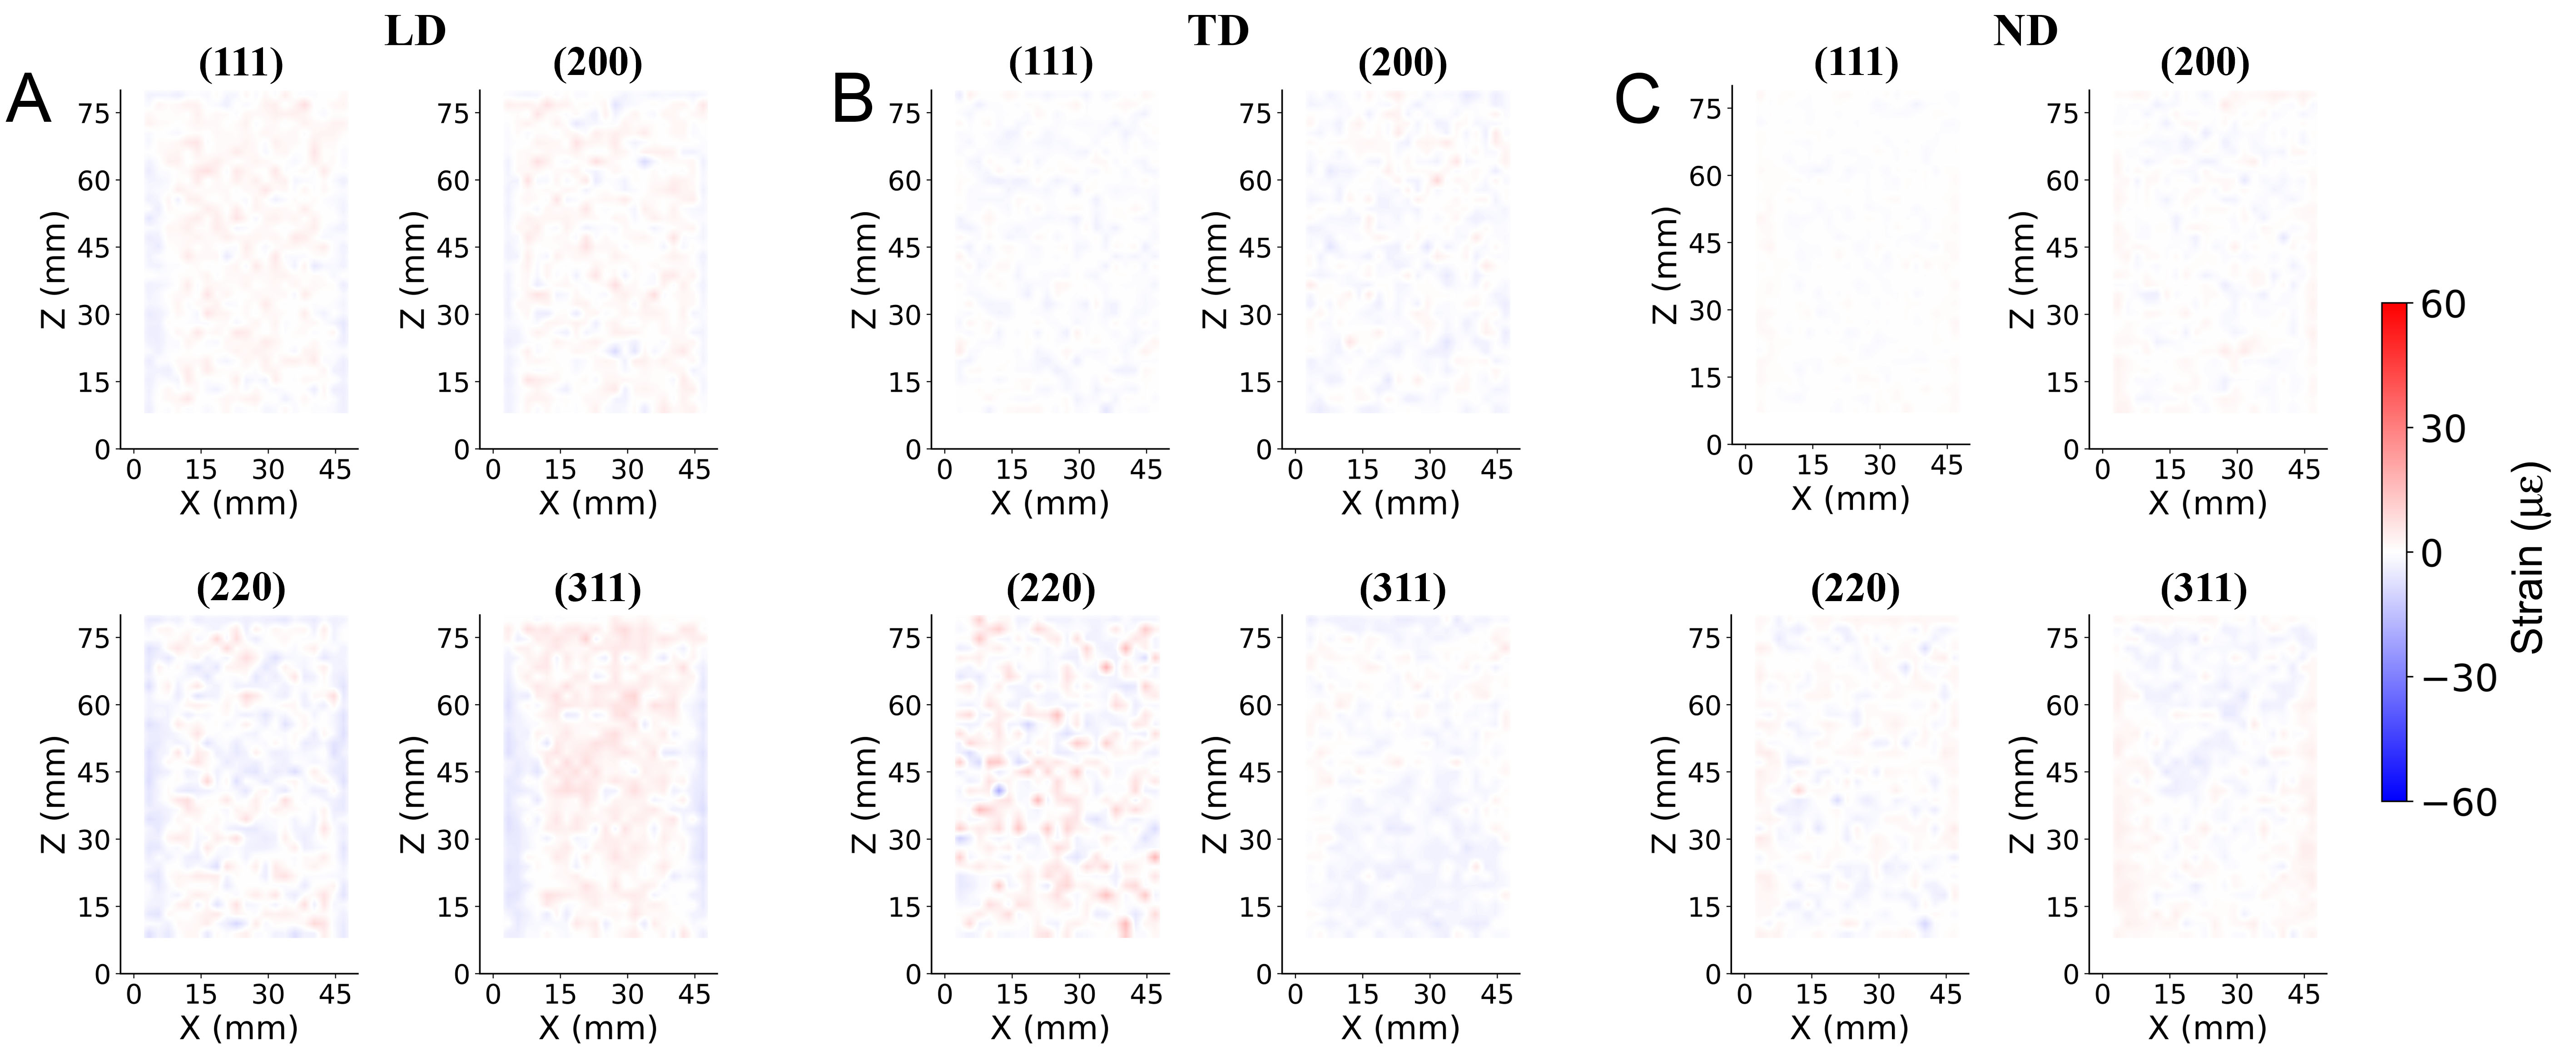
Figure 8. Maps showing the difference in measured residual strain between the Pseudo-Voigt and Pearson VII profile for fitting X-ray diffraction data from additively manufactured IN718. Results are shown for the (A) LD, (B) TD, and (C) ND strain difference. The color scale indicates differences in values, with positive values indicating that the Pseudo-Voigt fit resulted in a larger strain magnitude and negative values indicating a smaller strain magnitude than the Pearson VII fit. Each map corresponds to a different crystallographic plane (hkl), as indicated above each panel. LD: Loading direction; TD: transverse direction; ND: normal direction; IN718: Inconel 718.





