




fig2
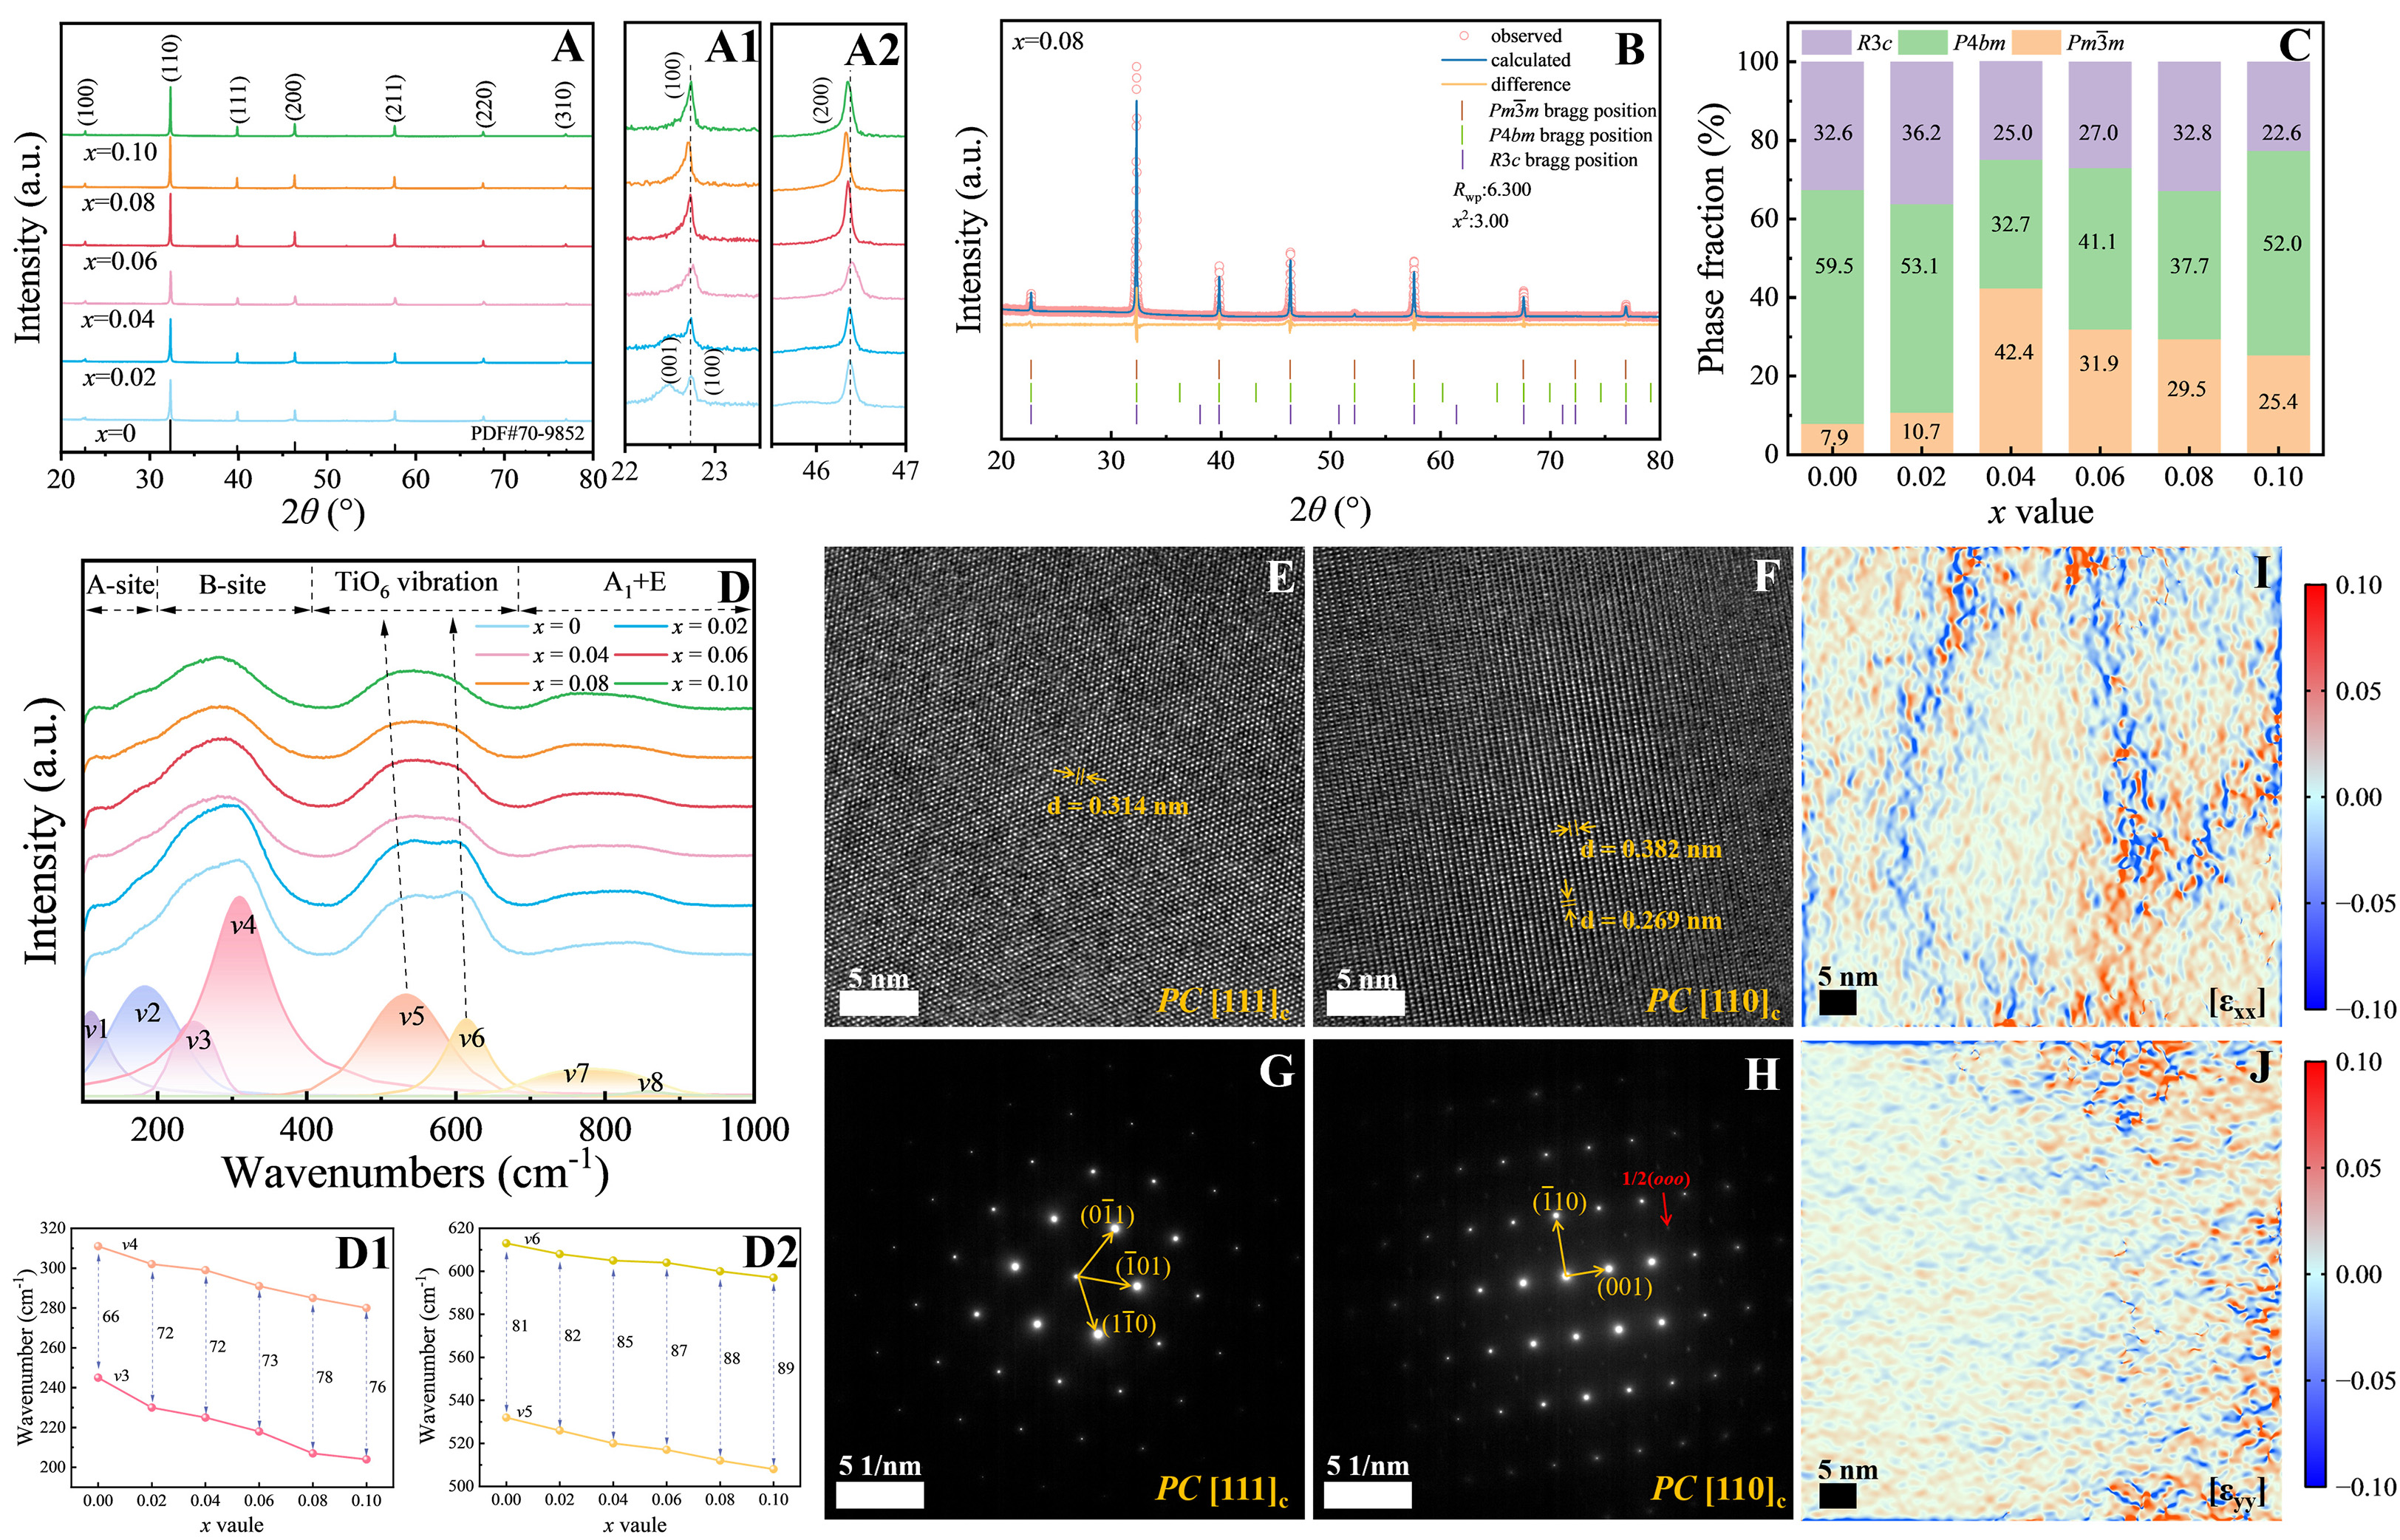
Figure 2. Structural characterization of the BNBST-xLMN ceramics. (A) XRD patterns of all compositions, with enlarged views shown in (A1) 22°-23.5° and (A2) 45.5°-47°. (B) Rietveld refinement of the x = 0.08 ceramic. (C) Fraction evolution of different phases versus the x value. (D) Raman spectra of all samples and their Lorentzian deconvolution results. Wavenumber shifts of the (D1) v3/v4 and (D2) v5/v6 phonon modes versus the x value. HR-TEM images of the x = 0.08 ceramic along the (E) [111]c and (F) [110]c axes. SAED patterns along the (G) [111]c and (H) [110]c axes. GPA results showing the (I) [εxx] and (J) [εyy] strain directions for the x = 0.08 ceramic.





