




fig3
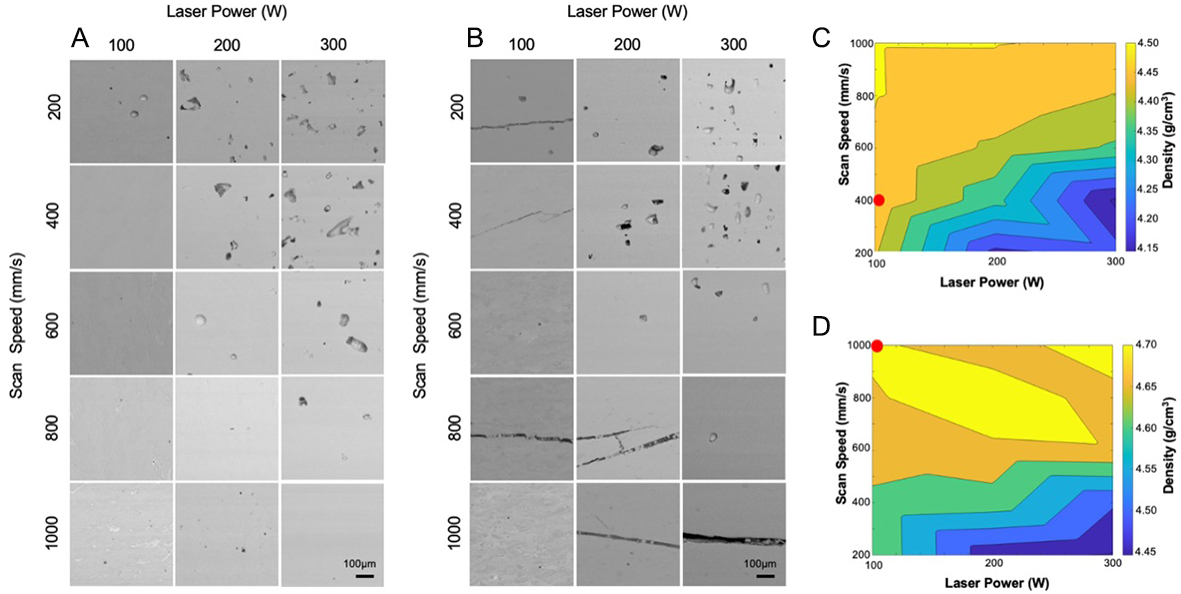
Figure 3. Process parameter optimisation and densification behaviour of BP-LPBF Ti-Cu alloys. (A and B) Representative micrographs of Ti-3Cu (A) and Ti-11.5Cu (B) samples produced across a range of laser powers (100-300 W) and scan speeds (200-1,000 mm/s), illustrating the evolution of porosity and defect morphology with processing conditions. Samples were sectioned parallel to the build direction, and all micrographs are displayed with the build direction oriented vertically upwards. (C and D) Corresponding density contour maps for Ti-3Cu (C) and Ti-11.5Cu (D), showing the compositional dependence of the optimal processing window. Red dots represent the optimal processing conditions for Ti-3Cu (C) and Ti-11.5Cu (D), This figure is reprinted with permission[21].





