




fig1
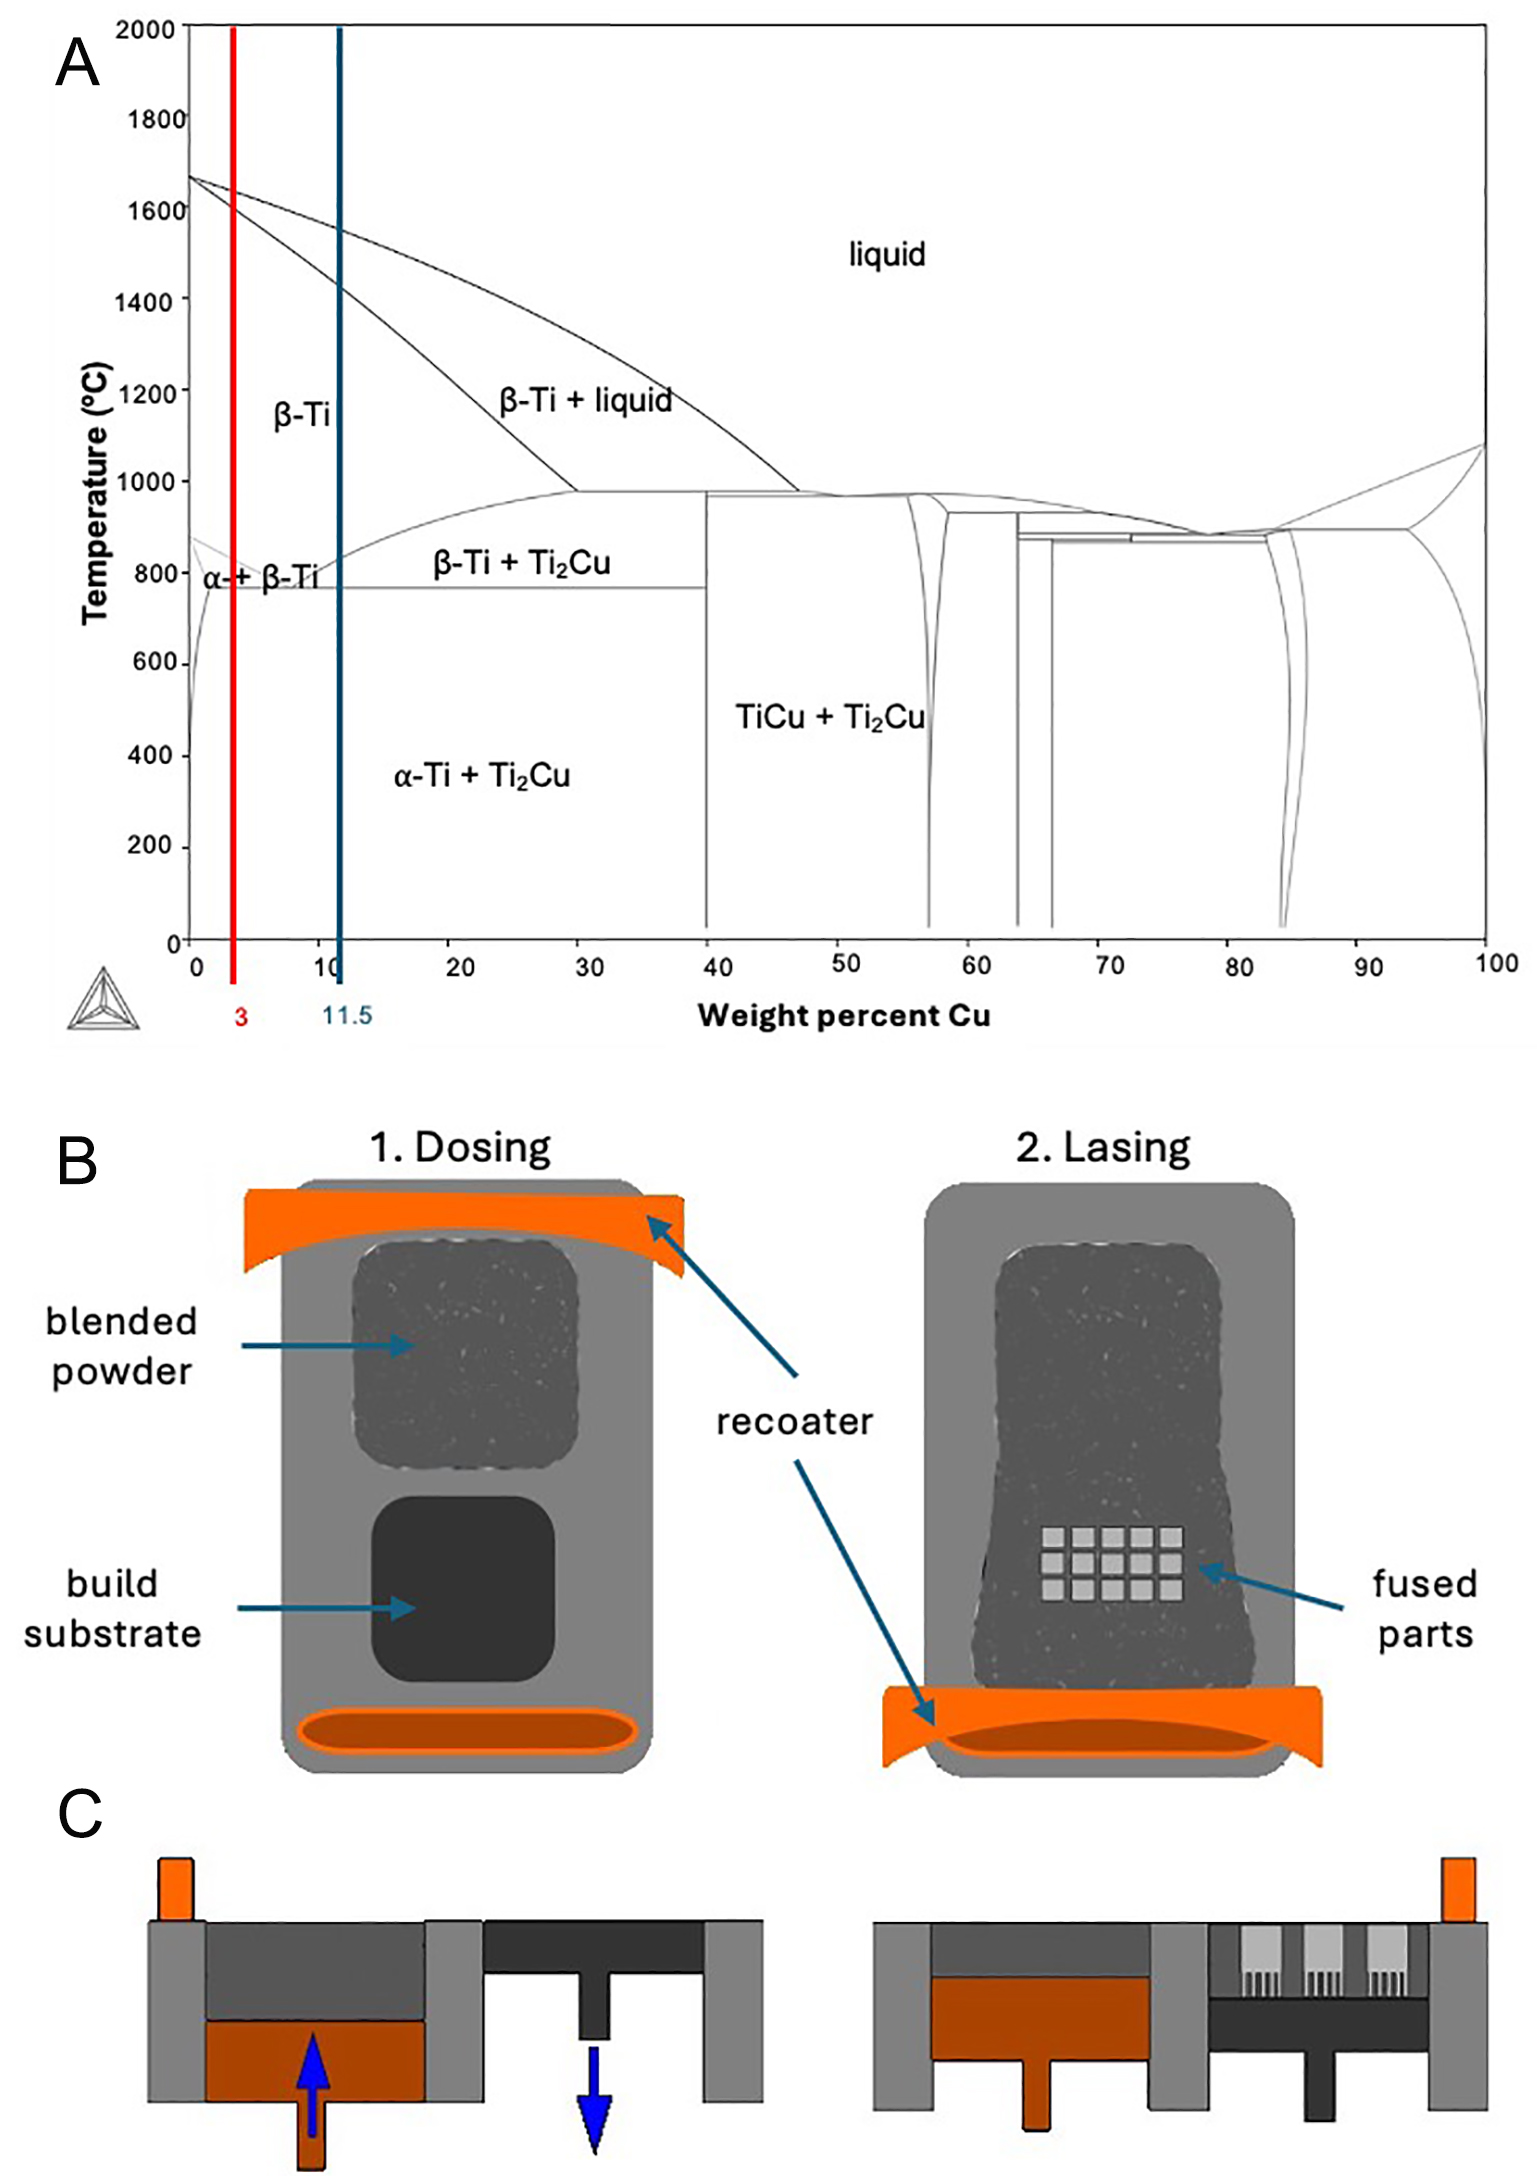
Figure 1. (A) Binary Ti-Cu phase diagram generated using Thermo-Calc 2023a and the TCTI2 database. The red and blue lines represent the Ti-3Cu and Ti-11.5Cu alloy compositions investigated in this work. (B and C) manufacturing process of blended powder samples through the use of a reduced build volume (RBV) unit.





