


fig4
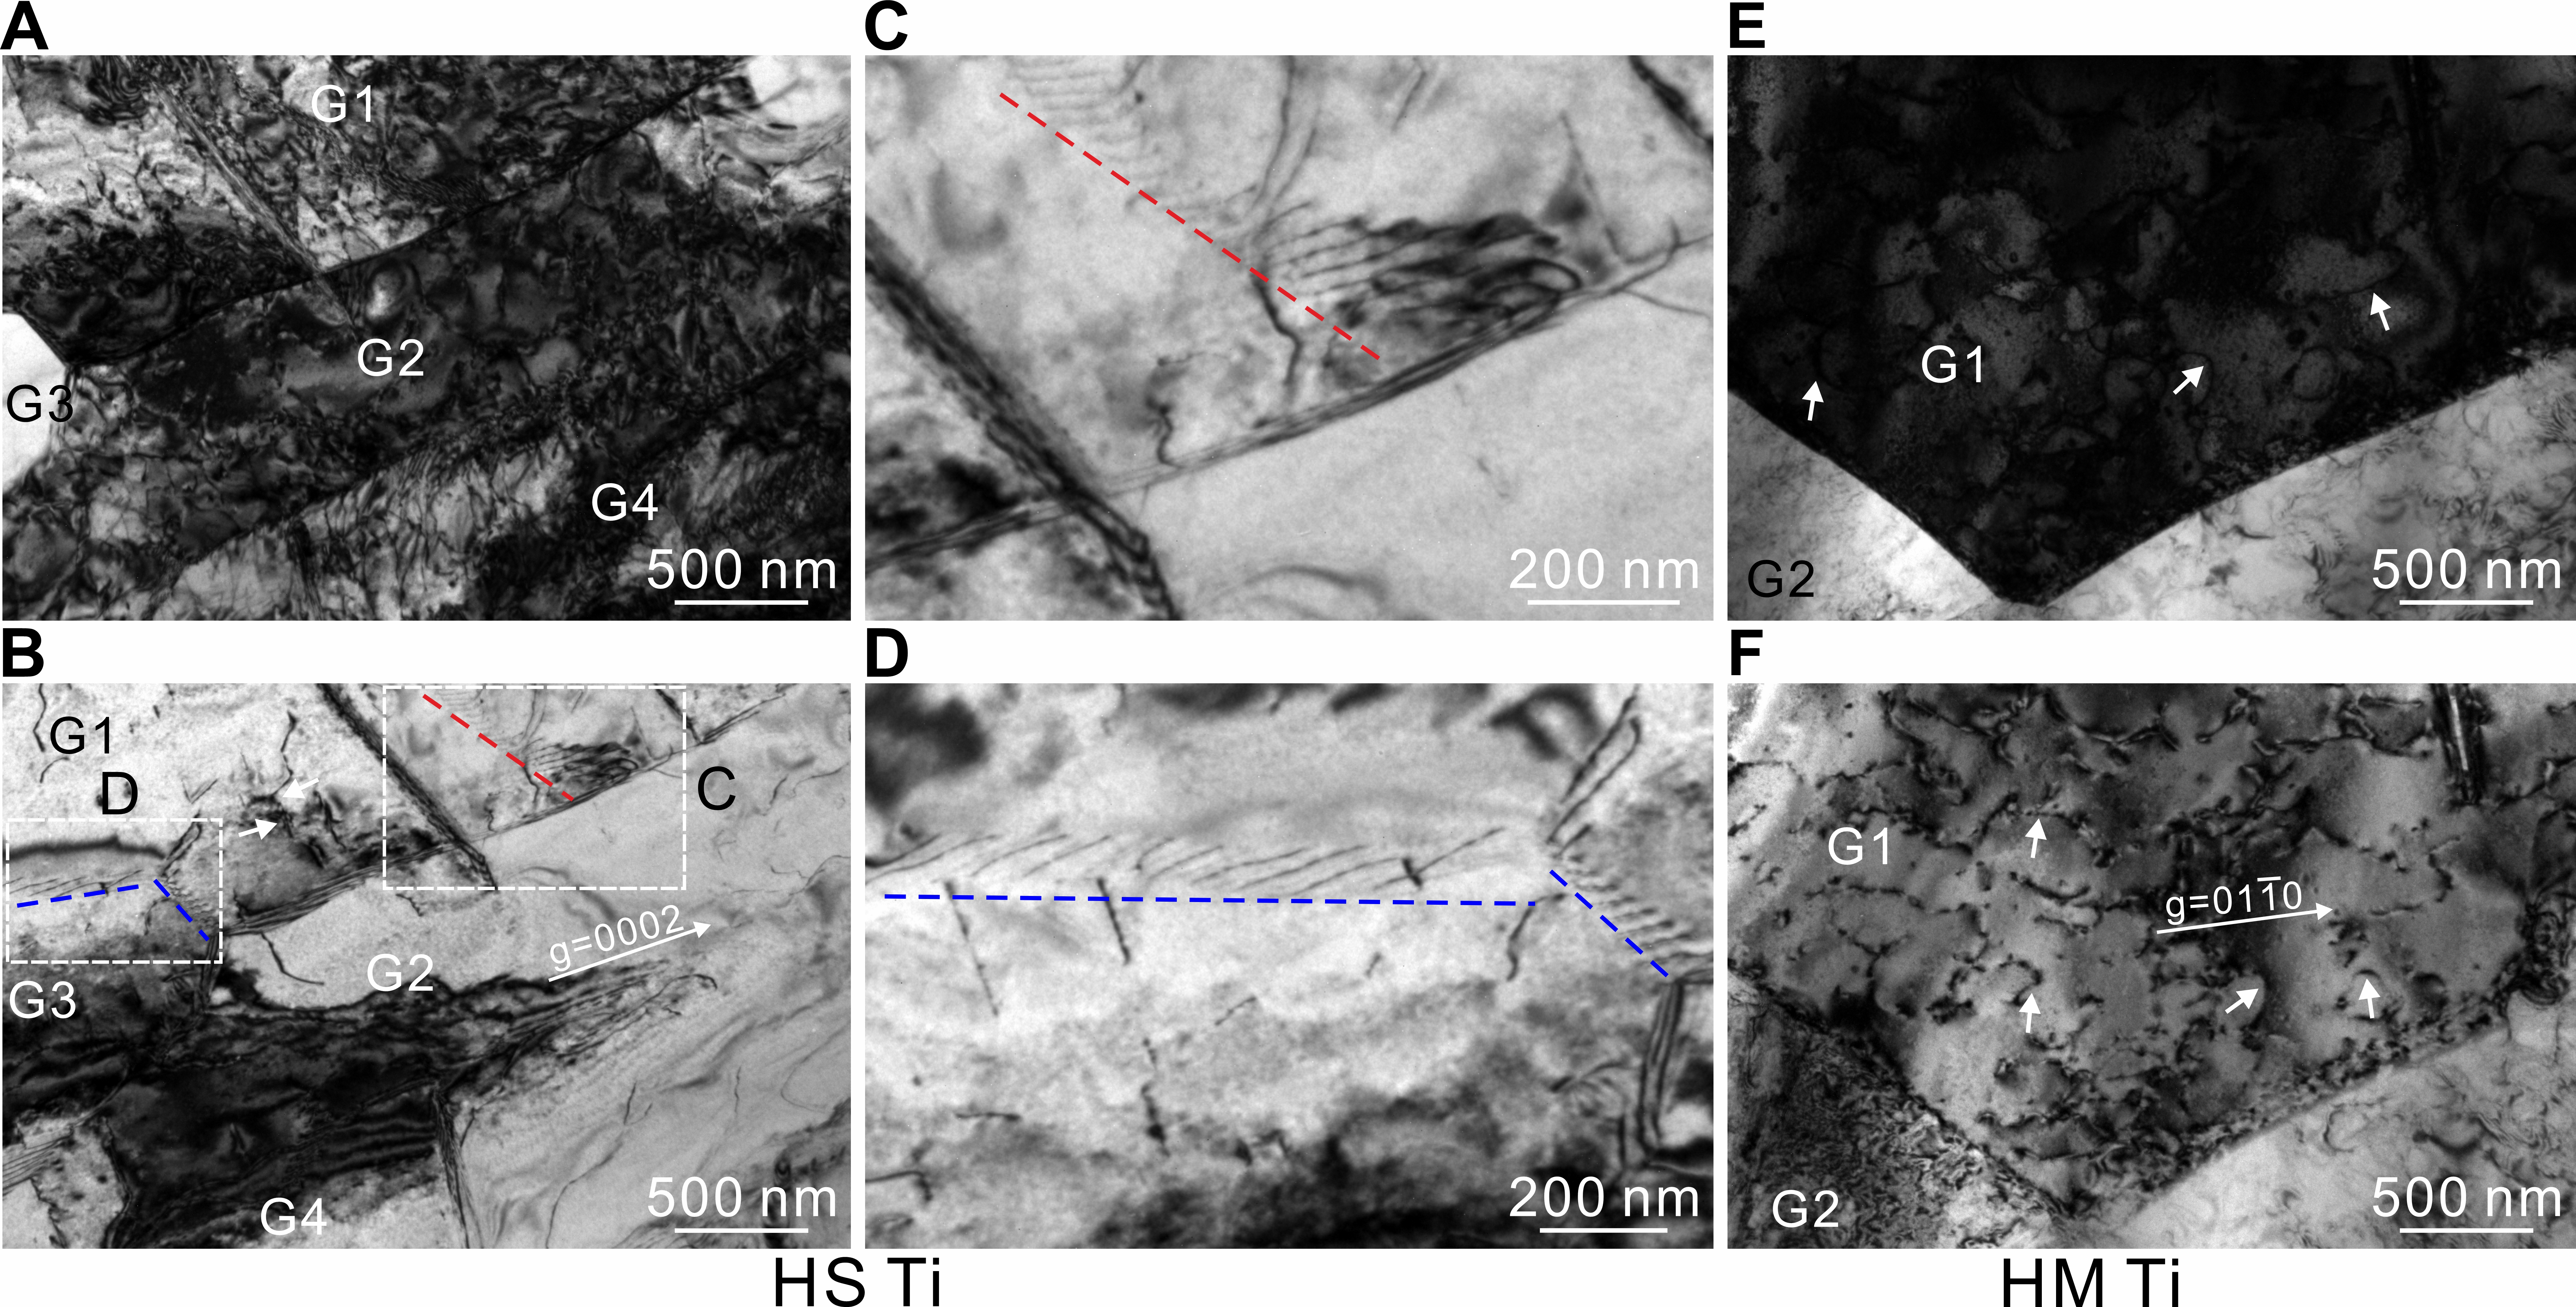
Figure 4. Bright-field (BF) TEM images showing dislocation characteristics in HS and HM Ti after fatigue. (A-D) HS Ti after fatigue at σmax = 375 MPa and Nf= 107. The electron beam direction is approximately parallel to the
Figure 4. Bright-field (BF) TEM images showing dislocation characteristics in HS and HM Ti after fatigue. (A-D) HS Ti after fatigue at σmax = 375 MPa and Nf= 107. The electron beam direction is approximately parallel to the


All published articles are preserved here permanently:
https://www.portico.org/publishers/oae/


