


fig5
From: Microhaplotype insights into the population structure of seven ethnic minorities in Guizhou, China
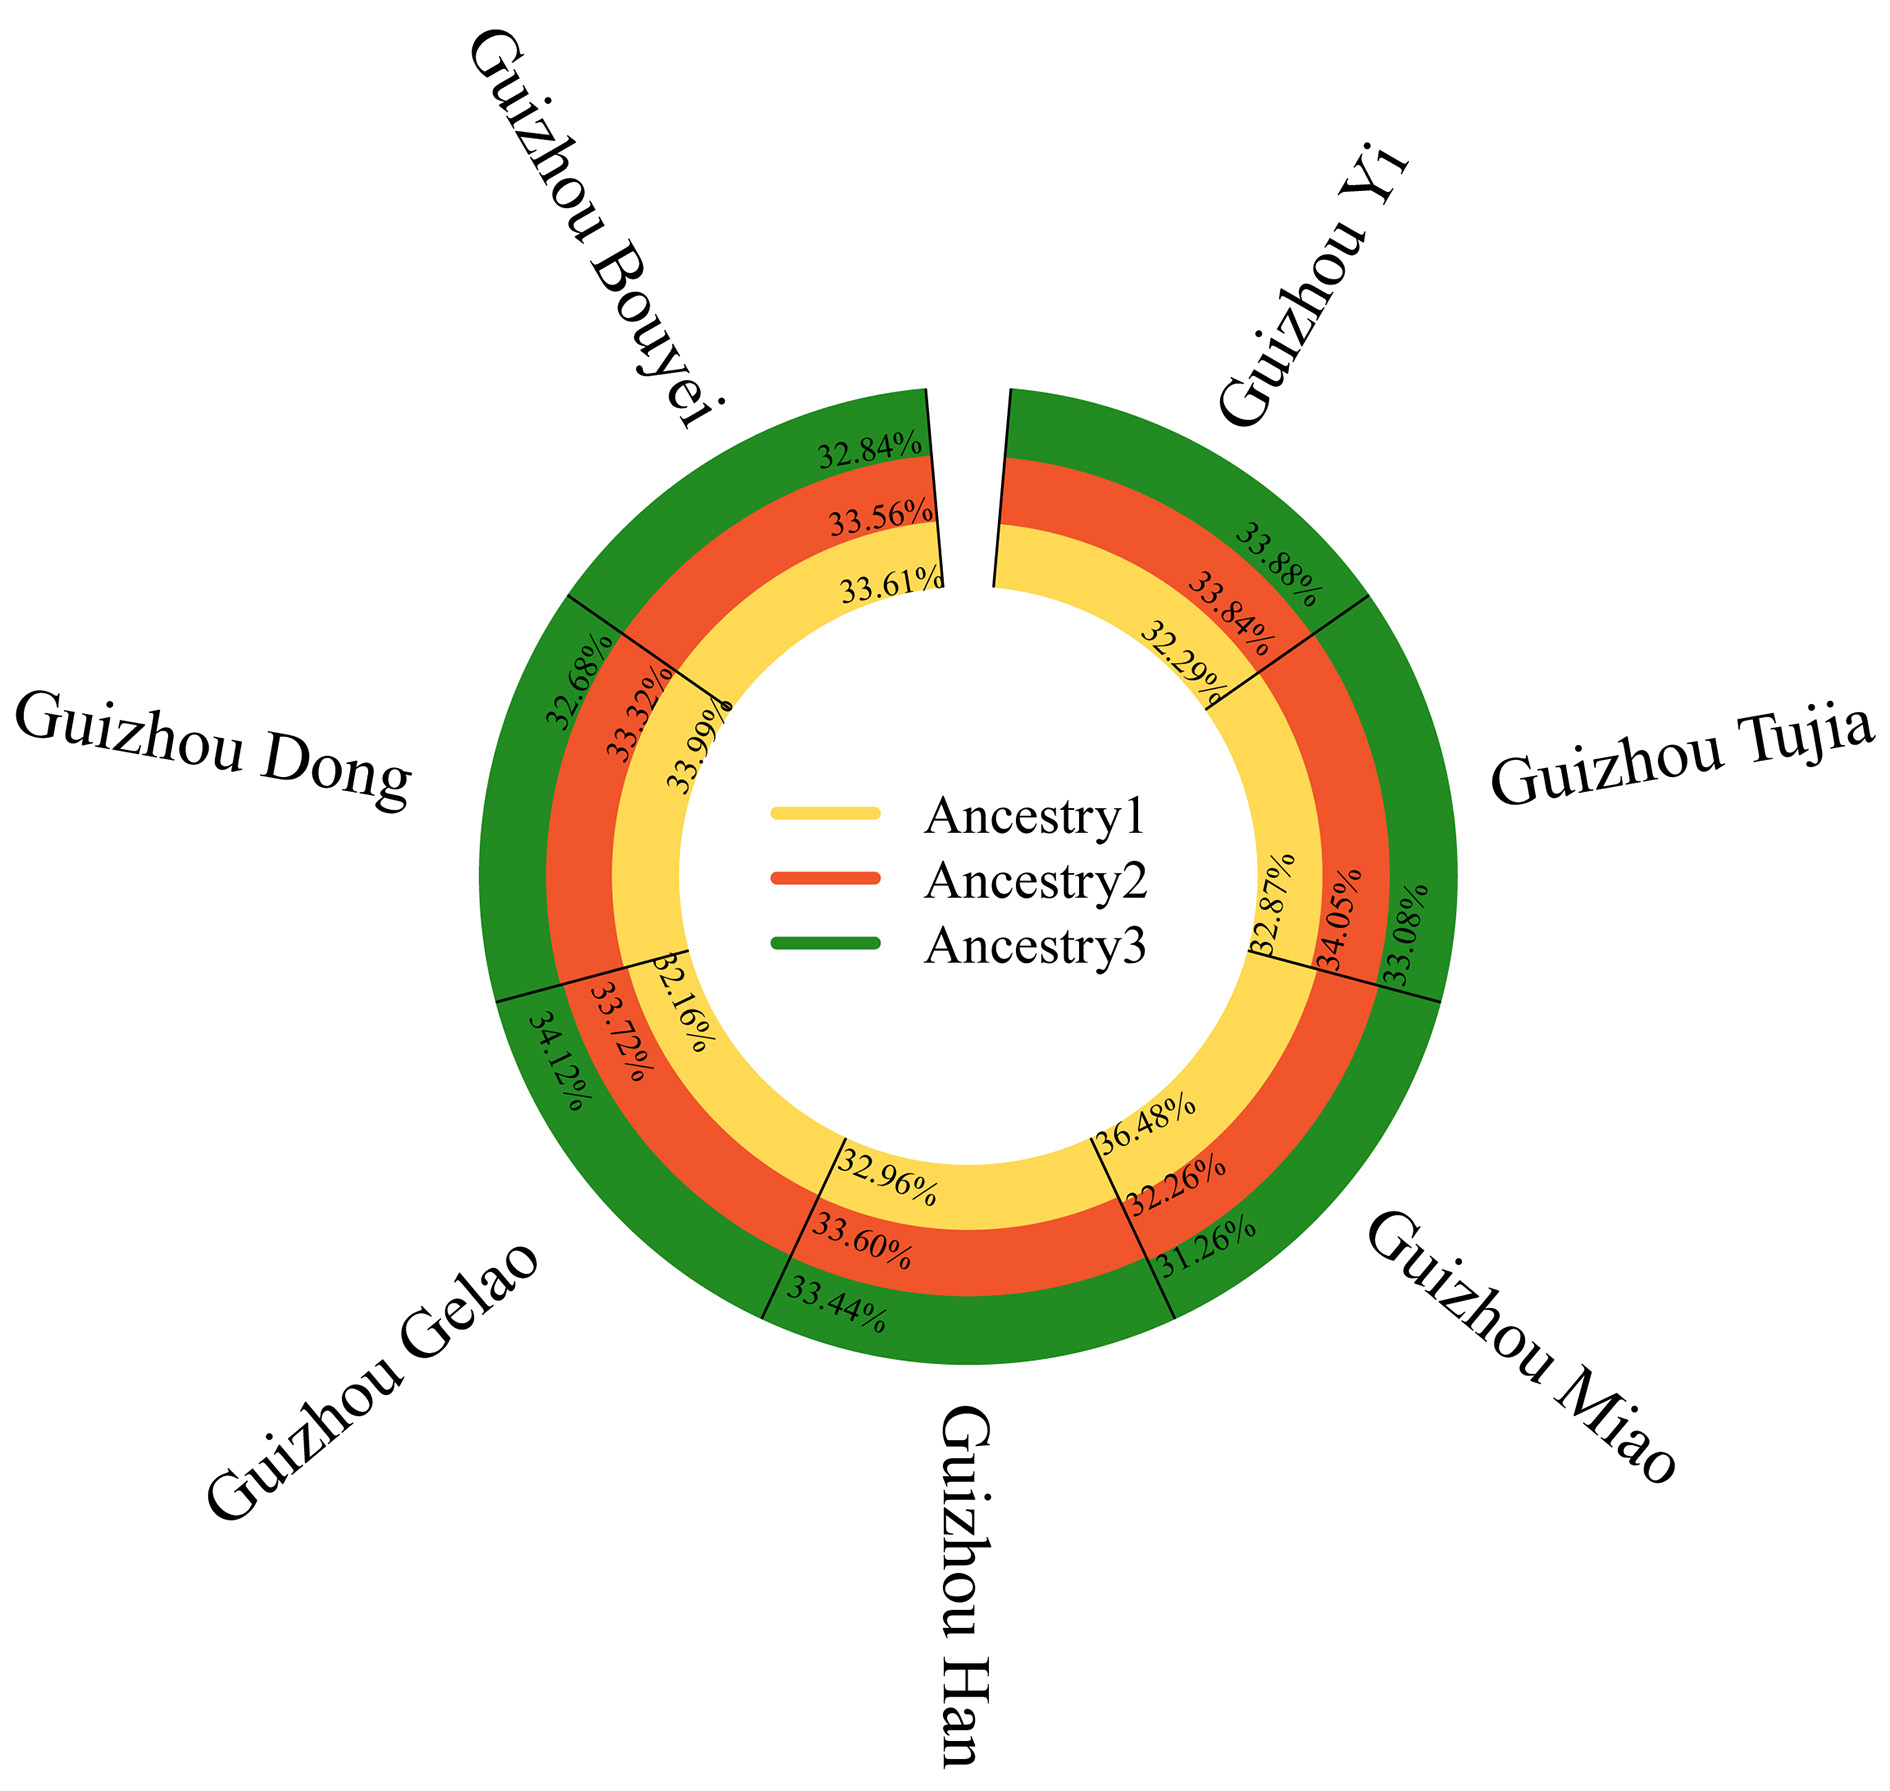
Figure 5. STRUCTURE analysis (K = 3) revealing genetic clusters among seven Guizhou populations. Ancestral components are color-coded as yellow (ancestry 1), red (ancestry 2), and green (ancestry 3), with the proportion of each component labeled for each population.


