


Microhaplotype insights into the population structure of seven ethnic minorities in Guizhou, China
 0
0 Abstract
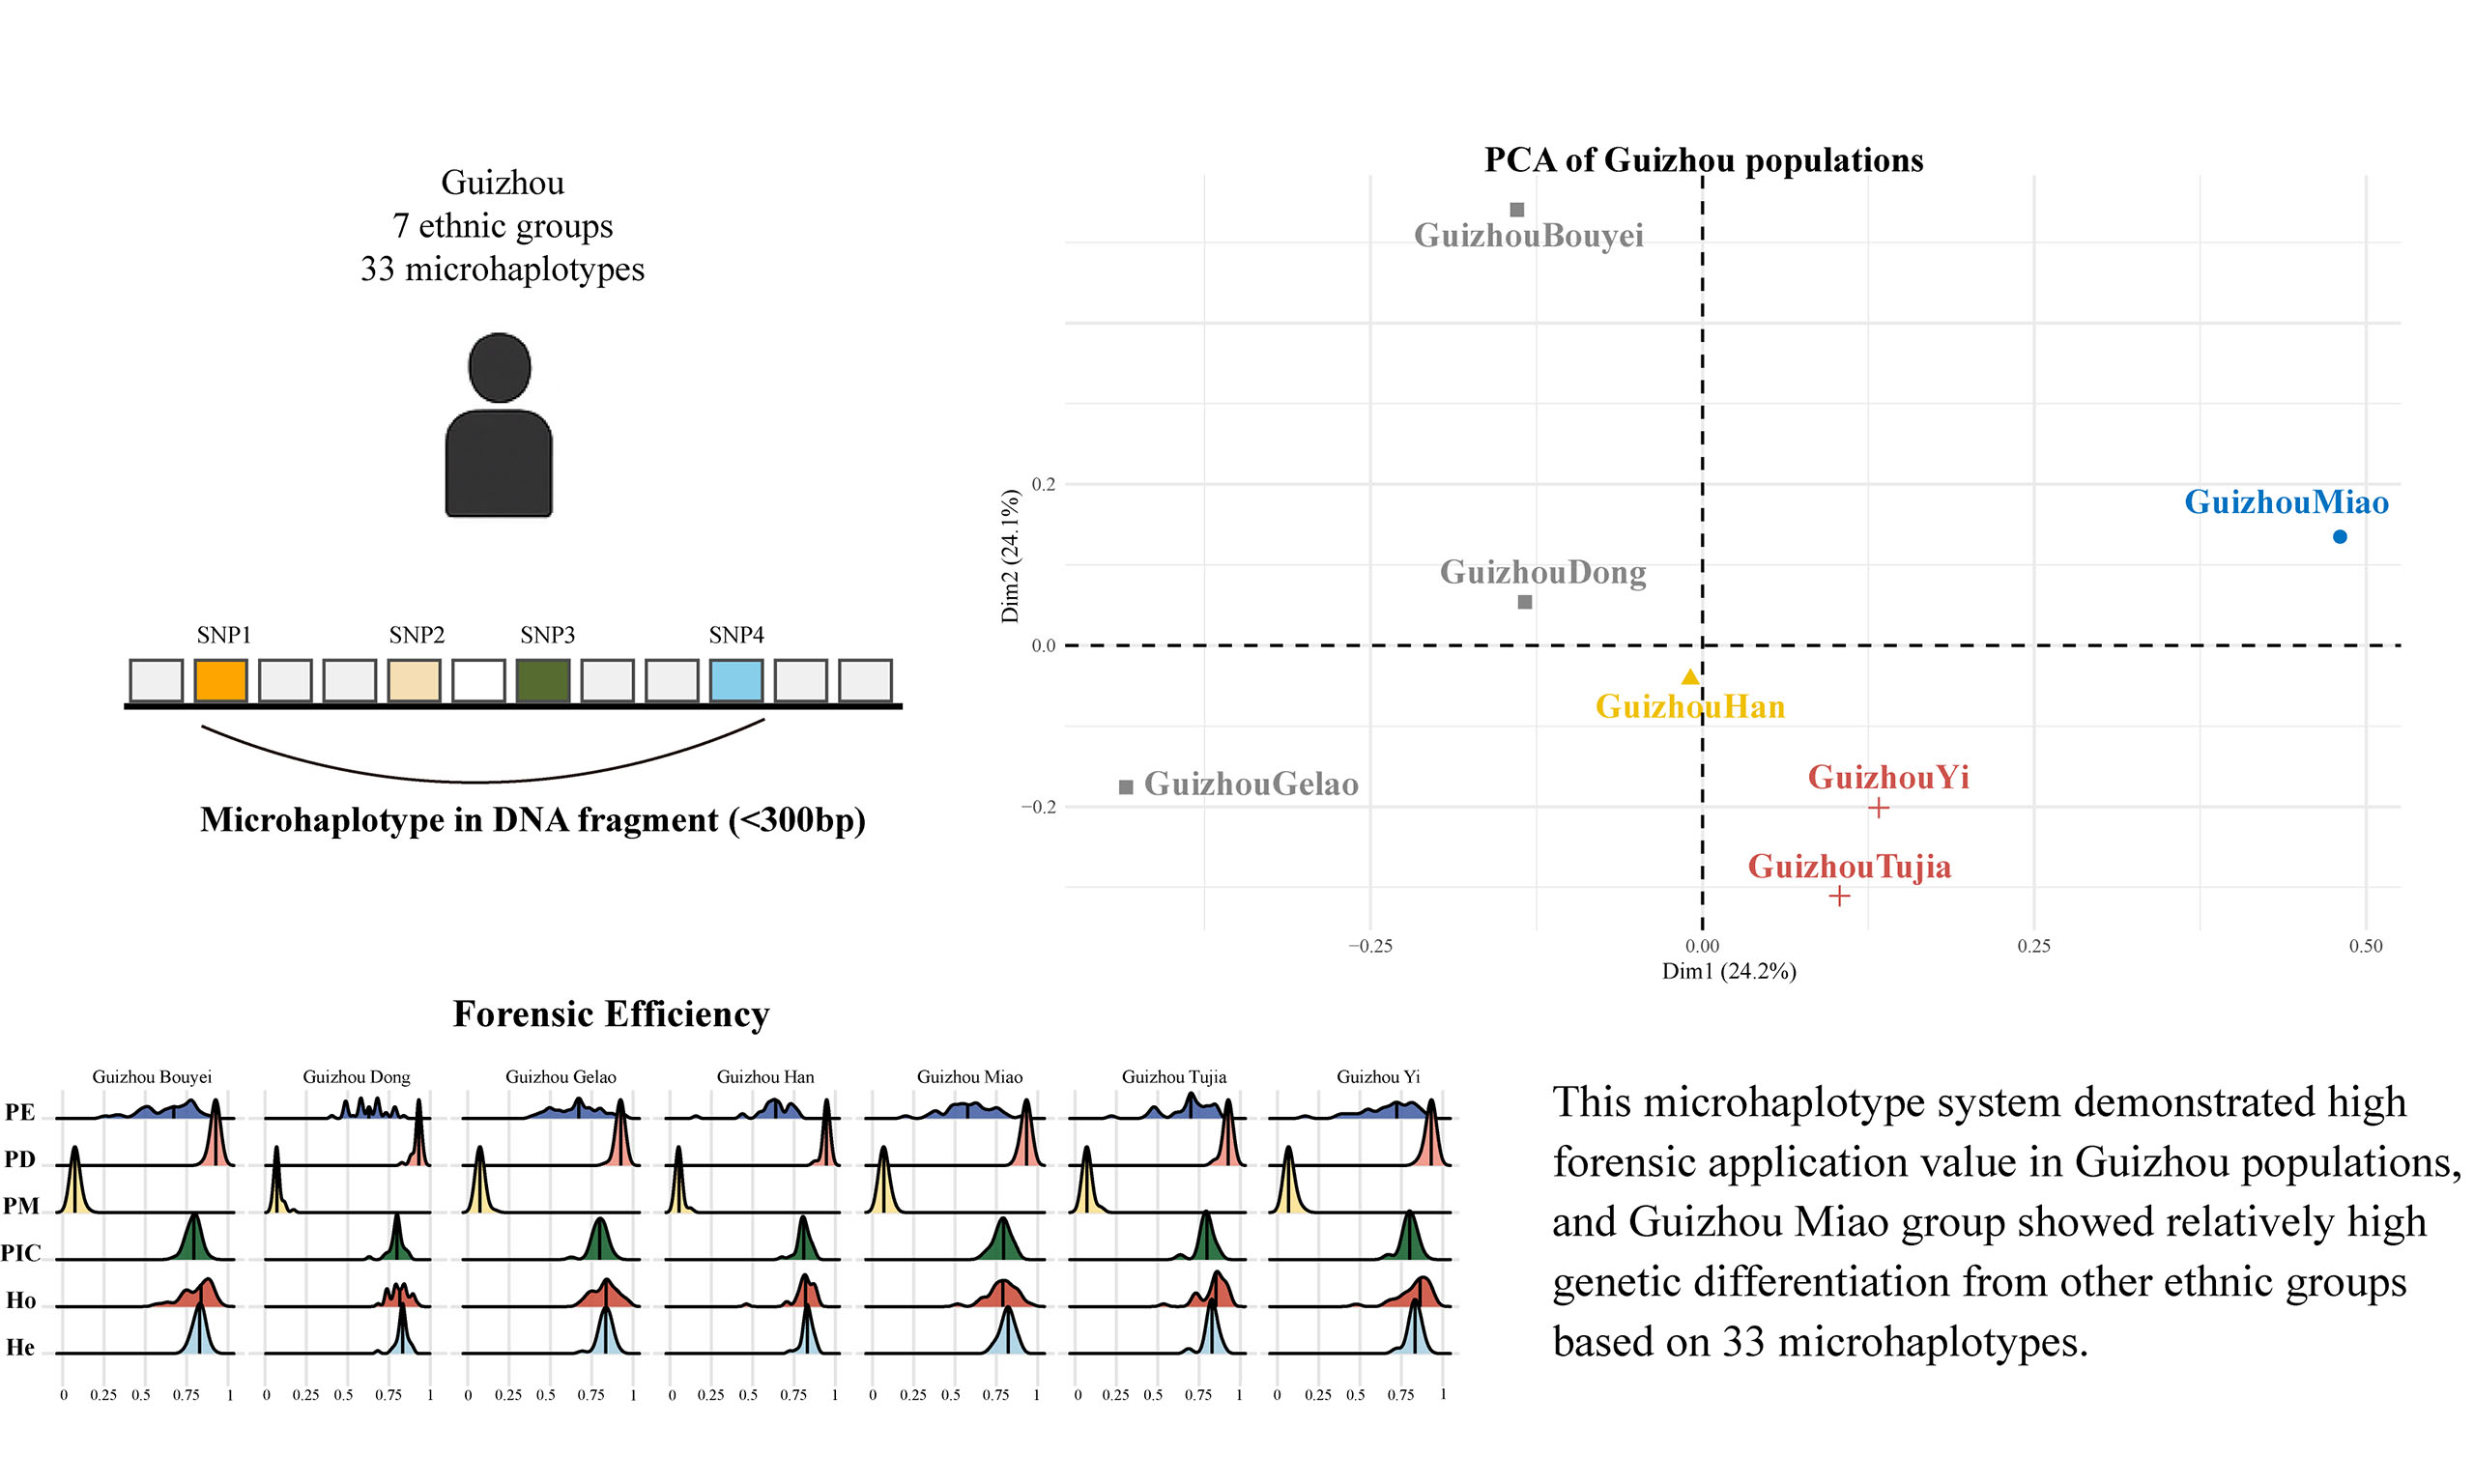
Aim: This study aimed to elucidate the population genetic structure of seven ethnic groups in Guizhou Province, China - namely the Bouyei, Dong, Gelao, Miao, Han, Tujia, and Yi - by employing microhaplotypes as highly informative genetic markers.
Methods: Thirty-three microhaplotype loci were genotyped using multiplex PCR amplification combined with next-generation sequencing. Based on the genotype data, a phylogenetic tree was constructed, and multidimensional scaling, principal component analysis, and population structure analysis were performed to comprehensively assess genetic diversity, population differentiation, and interpopulation relationships.
Results: The analyses revealed a high degree of genetic affinity and frequent gene flow among the Guizhou populations. However, the Miao group exhibited relatively greater genetic differentiation compared with the other groups (pairwise Fst values ranging from 0.0023 to 0.0054), although the extent of this differentiation was modest.
Conclusion: This study provides new insights into the complex population genetic architecture of ethnic minorities in Guizhou and further contributes to the regional microhaplotype genetic database.
Keywords
INTRODUCTION
Guizhou Province, located in southwest China, has a history shaped by the interplay of military settlement and economic migration[1], making it one of the most ethnically diverse regions in East Asia. Among its 18 indigenous ethnic groups, the Bouyei, Dong, Gelao, Miao, Han, Tujia, and Yi are the most prominent. Guizhou is characterized by a distinctive karst landscape and a three-dimensional ecological defense system formed by interlocking mountains and gorges. This unique geography has, to some extent, restricted free population movement and gene flow, thereby fostering a setting where cultural coexistence and genetic diversity among multiple ethnic groups have persisted[2,3]. Conventional genetic markers, including short tandem repeats (STRs), single nucleotide polymorphisms (SNPs), and mitochondrial DNA (mtDNA), have provided valuable insights into the genetic relationships among ethnic groups in Southwest China. For example, Tan et al. investigated the population structure of the two largest Miao groups in Guizhou using SNPs[4]; Zhang et al. analyzed Y-chromosomal haplogroup distribution patterns among Kra-Dai language-speaking populations, including the Bouyei, Dong, and Gelao[5]; Sun et al. examined four populations from the Zunyi region using autosomal STRs[6]; Liu et al. revealed the complex maternal genetic structure of the Gelao through complete mitochondrial genome sequencing[7]; and He et al. characterized the maternal genetic composition of twelve ethnic minorities in Guizhou via mtDNA analysis[8]. While STRs, SNPs, and mtDNA remain the cornerstone of forensic genetics, they have limitations when analyzing highly complex mixtures, severely degraded samples, or fine-scale population structures. The advent of high-throughput sequencing has facilitated the development of microhaplotypes as a new class of powerful genetic markers. Microhaplotypes are defined as haplotypic combinations of two or more tightly linked SNPs within a 200-300 bp DNA fragment[9,10]. Their high polymorphism and low recombination rates generate stable and precise genetic information[9,11]. Because of their high discriminatory power arising from dense SNP combinations, microhaplotypes hold great promise for individual identification, paternity testing, and forensic ancestry analysis[12-15]. Although international studies have validated the forensic utility of microhaplotypes across different populations[16-21] and established reference databases[22,23], research on microhaplotypes in Guizhou remains limited and at a preliminary stage, constraining their broader application in forensic region.
In a previous study, we optimized locus selection to construct a multiplex amplification panel comprising 33 microhaplotypes[24], which demonstrated high levels of genetic polymorphism in East Asian populations. This panel also showed strong utility for forensic identification and paternity testing in the Guizhou Han population. Building on this foundation, we employed the microhaplotype panel as the primary tool to systematically dissect genetic divergence and population structure among seven representative ethnic groups in Guizhou (n = 458): Bouyei, Gelao, Dong, Miao, Han, Tujia, and Yi. To this end, we performed principal component analysis (PCA), multidimensional scaling (MDS), phylogenetic tree construction, and population structure analysis based on the genotypic data from all sampled individuals. The overarching objective of this research is to elucidate genetic relationships and differentiation patterns among these groups, thereby contributing new data to advance the understanding of the genetic architecture of Guizhou’s diverse populations.
METHODS
Sample collection and DNA extraction
A total of 257 peripheral blood samples were collected from six ethnic minority groups in the Guizhou region: 37 Bouyei, 38 Dong, 31 Gelao, 66 Miao, 41 Tujia, and 44 Yi individuals. Written informed consent was obtained from all participants. Additionally, 201 Han Chinese individuals from a previous study were included as a comparison group[24]. DNA was extracted from all samples using the magnetic bead-based method with IGT™ Pure Beads, following the manufacturer’s recommended protocol.
Library preparation
DNA libraries were constructed using the standard MultipSeq® Custom Panel protocol, involving two rounds of PCR amplification followed by purification with IGT™ Pure Beads. The first PCR was carried out in a 30 μL reaction mixture containing 1 ng of template DNA, 9 μL nuclease-free water, 3.5 μL Enhancer Buffer NB (1N), 2.5 μL Enhancer Buffer M, 5 μL Primer pool, and 10 μL IGT-EM808 polymerase mixture. The cycling conditions were: 95 °C for 3 min 30 s; 22 cycles (98 °C for 20 s, 55 °C for 60 s, 60 °C for 60 s, and 65 °C for 2 min); followed by a final extension at 72 °C for 5 min. The PCR product was purified with IGT™ Pure Beads and used as the template for the second PCR. The second PCR was performed in a 30 μL reaction containing 13.5 μL purified product, 2.5 μL Enhancer Buffer M, 2 μL UDI Index (5 μM), 10 μL IGT-EM808 polymerase mixture, and 2 μL nuclease-free water. The cycling conditions were: 95 °C for 3 min
Microhaplotype genotyping
Raw sequencing data underwent quality control and bioinformatic analysis as detailed below. First, preprocessing and filtering were performed with Trimmomatic (v0.38)[25]. Raw FASTQ files were processed using an 8-bp sliding window (average score < 20) to trim low-quality regions. Adapter sequences and low-quality bases at read termini were removed, and reads with a mean quality < 20 or length < 40 bp were discarded. Next, the high-quality reads were aligned to the GRCh38 reference genome[26,27] using BWA (v0.7.12)[28] for variant calling and comparison with the reference sequence. Microhaplotype genotyping and downstream analysis were conducted with custom Perl scripts (https://github.com/moonlightfurion/microhaplotype). Haplotypes with a frequency ≥ 15% and a depth ≥ 20× were retained. If multiple haplotypes met these criteria, the two most frequent were defined as the genotype for the corresponding locus. Haplotypes failing to meet the criteria were marked as missing. This filtering ensured the accuracy and reliability of the microhaplotype dataset, providing a robust foundation for subsequent population genetic analyses.
Statistical analysis
Population genetic statistics were computed using a range of software tools. Hardy-Weinberg equilibrium (HWE) and linkage disequilibrium (LD) were assessed, and core forensic parameters were calculated using STRAF[29] (http://straf.uni-frankfurt.de/). Pairwise DA distances and Fst values were estimated with Dispan[30] and Genepop (4.0.10)[31], respectively. Population genetic analyses of the seven Guizhou groups, including MDS and PCA, were conducted in R (v4.4) using the vegan (v2.6-8), ggplot2 (v3.5.1), and factoextra (v1.0.7) packages. A phylogenetic tree was reconstructed using the unweighted pair group method with arithmetic mean (UPGMA) in MEGA (10)[32], based on pairwise Fst values. Ancestry components of the seven populations were inferred using STRUCTURE (v2.3.4)[33]. The optimal number of clusters (K) was determined with StructureHarvester (cpython-312)[34]. Replicate runs were merged in CLUMPP (v1.1)[35], and the final bar plots were visualized using pophelper (v1.0.10)[36] and AncestryPainter (v2.0) in R[37].
RESULTS
HWE and LD tests
The results of HWE and LD analyses for 33 microhaplotypes in the Guizhou Bouyei, Dong, Gelao, Miao, Tujia, Yi, and Han populations are presented in Supplementary Tables 1 and 2. After Bonferroni correction (P = 0.05/33), deviations from HWE were observed at three loci: mh03LV-01 in the Guizhou Bouyei and Han populations, mh19WL-014 in the Han population, and mh22WL-008 in the Miao, Han, and Yi populations. All other loci conformed to HWE expectations. Furthermore, no statistically significant LD was detected among the 33 microhaplotype loci after correction (P = 0.05/528), indicating that these loci could be considered independent in these Guizhou populations.
Haplotype polymorphism
We analyzed haplotype distributions of the 33 microhaplotype loci across six Guizhou minority populations (Bouyei, Dong, Gelao, Miao, Yi, and Tujia) and the Han population, as shown in Figure 1A. Most loci exhibited moderate to high polymorphism across all groups, with the number of haplotypes per locus ranging from 4 to 27. The Guizhou Han population showed the highest haplotype diversity, with loci such as mh01WL-048, mh02FHL-006, and mh03LV-01 presenting 27 haplotypes. In the Miao, Tujia, and Yi populations, haplotype counts generally ranged from 5 to 20, while the Bouyei population ranged from 4 to 17. The Gelao and Dong populations showed ranges of 5-15 and 6-18, respectively. Notably, mh01WL-048 and mh02FHL-006 consistently displayed high polymorphism, with 15-27 haplotypes across populations. In contrast, mh09WL-005 showed low variability, with only four haplotypes observed in the Bouyei population.
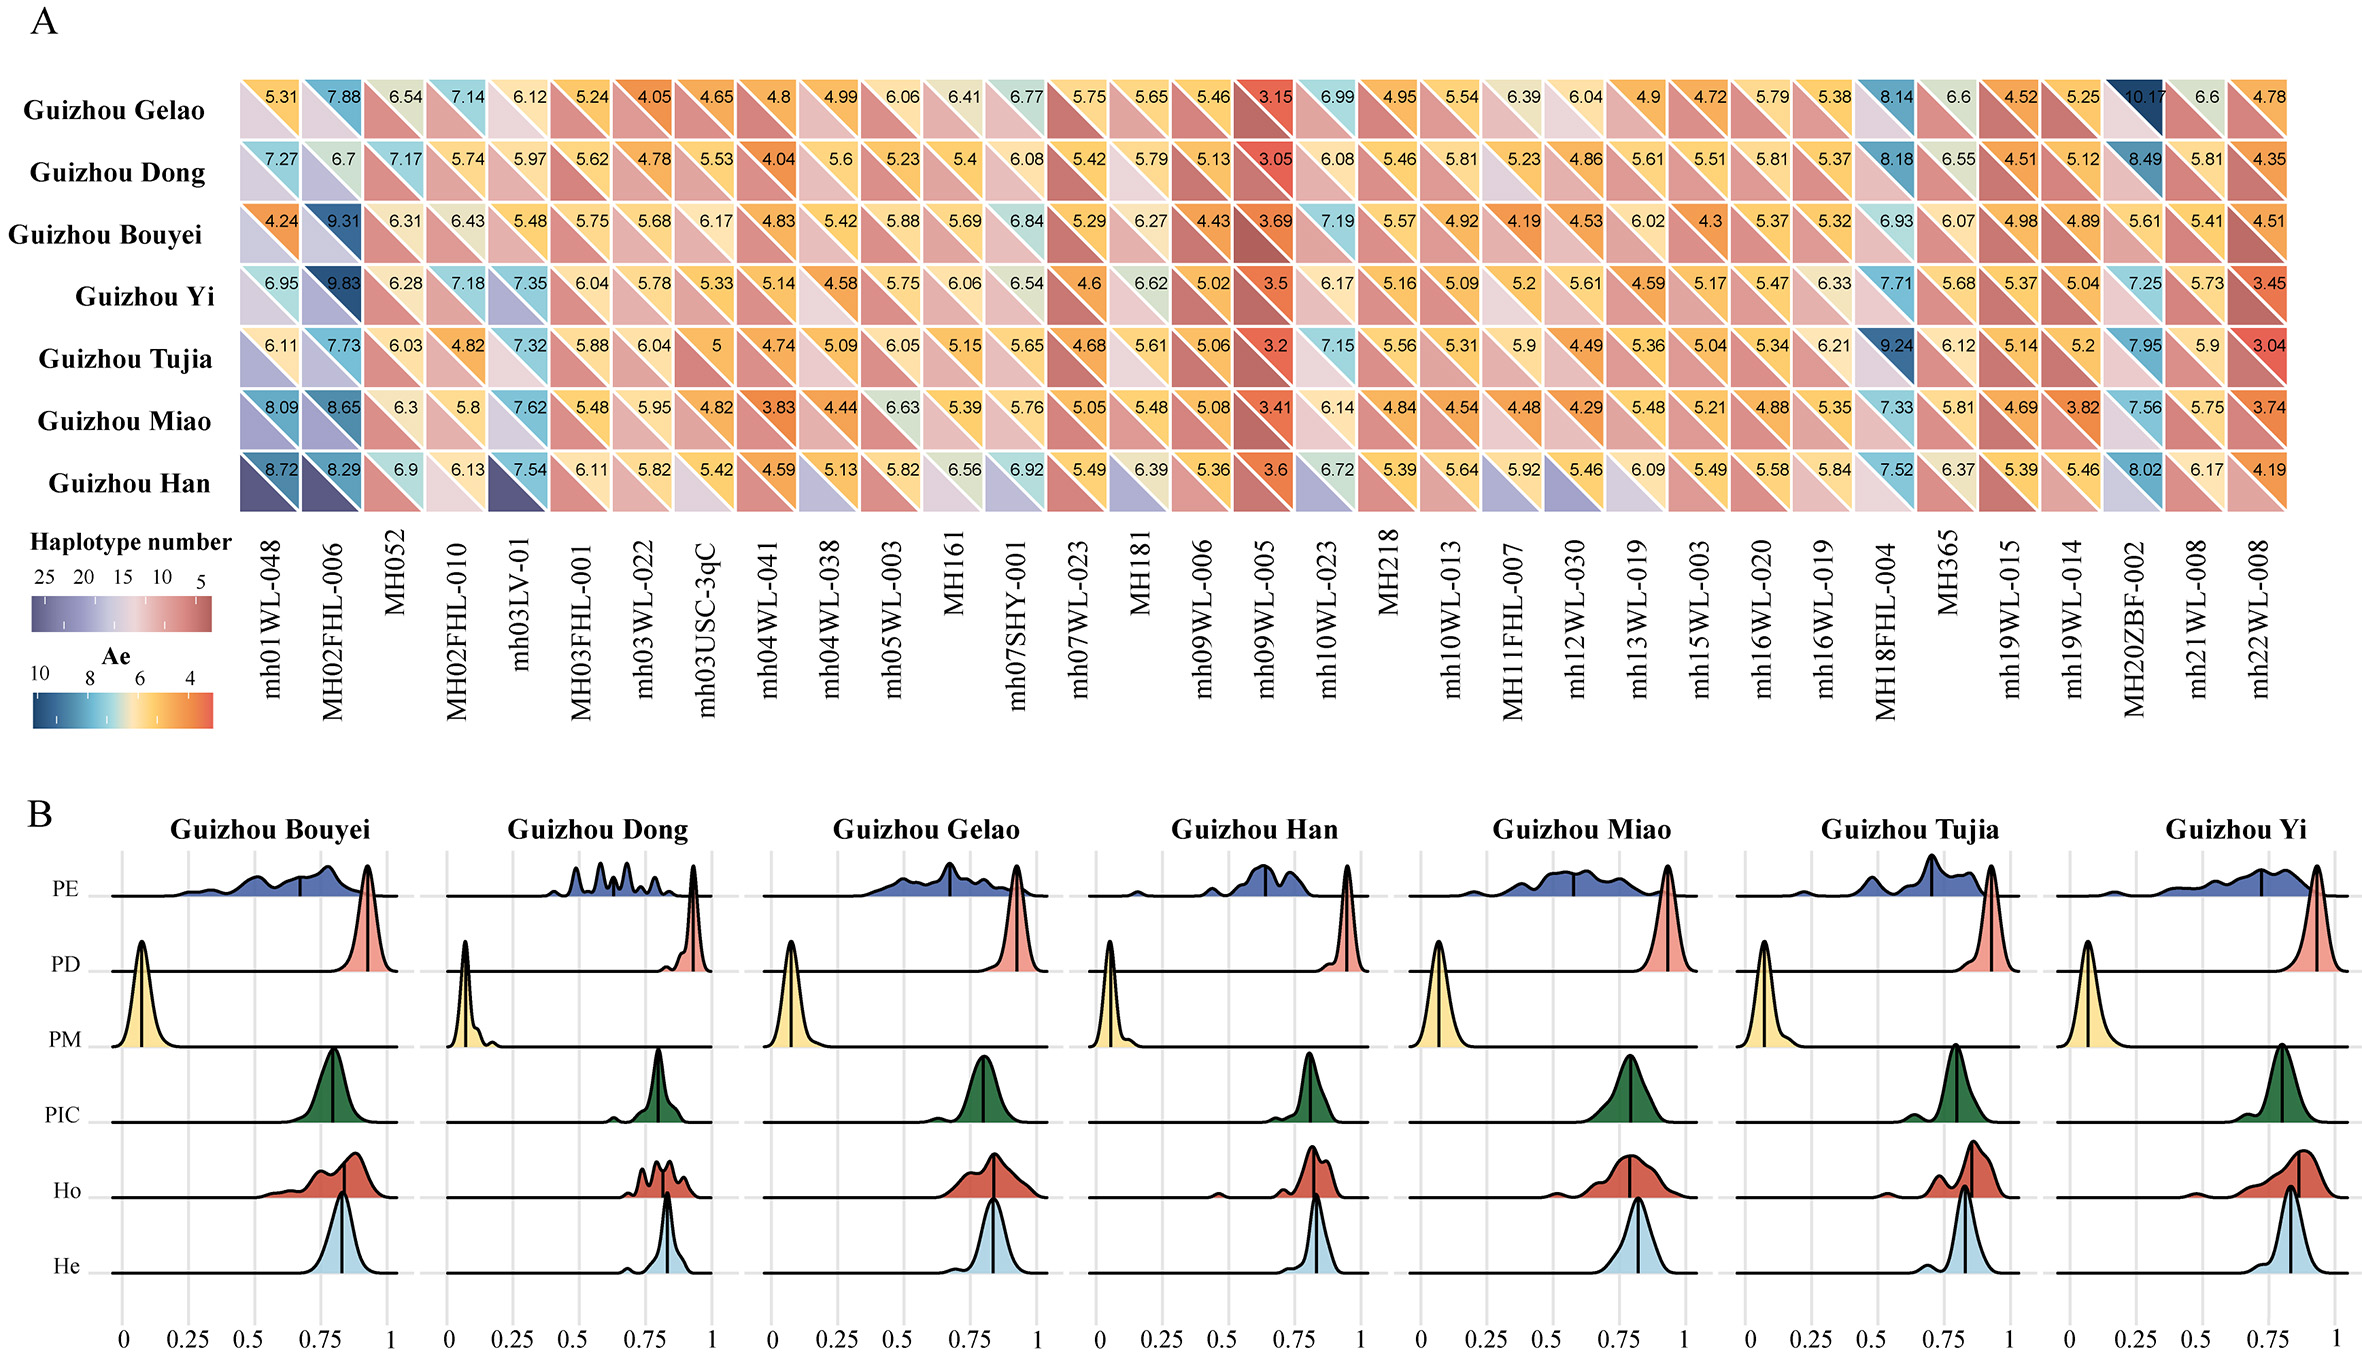
Figure 1. Haplotype counts and effective numbers of alleles for 33 microhaplotypes in seven Guizhou populations (A) and their associated forensic parameters (B). In panel A, the lower-left triangle shows the number of observed haplotypes, and the upper-right triangle shows the effective number of alleles for each locus. Panel B presents forensic parameters, including power of discrimination (PD), probability of exclusion (PE), probability of matching (PM), polymorphism information content (PIC), observed heterozygosity (Ho), and expected heterozygosity (He).
The effective number of alleles (Ae) was used to assess genetic diversity [Supplementary Table 3 and Figure 1A]. In the Han population, Ae values ranged from 3.6040 to 8.7212 (mean = 6.0626). The Miao population ranged from 3.4071 to 8.6514 (mean = 5.5064), Tujia from 3.0370 to 9.2363 (mean = 5.6702), and Yi from 3.4479 to 9.8274 (mean = 5.8048). For Bouyei, Ae values ranged from 3.6950 to 9.3129 (mean = 5.5606), and for Dong, from 3.0529 to 8.4941 (mean = 5.6750). The Gelao population had the highest Ae value at locus MH20ZBF-002 (10.1693), with a mean Ae of 5.8415. Loci mh02FHL-006 (6.7007-9.8274), MH20ZBF-002 (5.6107-10.1693), and MH18FHL-004 (6.9316-9.2363) consistently showed high Ae values across multiple groups, reflecting strong polymorphism and discriminative power. In contrast, mh09WL-005 and mh22WL-008 exhibited relatively low Ae values.
Evaluation of forensic potential
To evaluate the forensic utility of the 33 microhaplotypes in Guizhou populations, we calculated expected heterozygosity (He), observed heterozygosity (Ho), polymorphism information content (PIC), power of discrimination (PD), probability of matching (PM), and probability of exclusion (PE)
Population genetic distance analysis
In this study, we analyzed the genetic distances among seven ethnic groups in Guizhou province by calculating DA values [Supplementary Table 5]. The results revealed slight genetic differentiation across these populations. Notably, the Han population in Guizhou exhibited relatively small genetic distances to other groups, particularly with the Tujia population (DA = 0.0276). In contrast, the Gelao population in Guizhou showed higher DA values with other populations (average DA = 0.0469), with the highest value observed between the Gelao and Miao populations (DA = 0.0527). Furthermore, the largest genetic distance among the seven groups was observed between the Yi and Bouyei populations (DA = 0.0529). Subsequently, we calculated Fst values to quantify the extent of genetic differentiation among the seven ethnic groups in Guizhou [Supplementary Table 6]. The Guizhou Miao population exhibited relatively high genetic differentiation from other groups, especially with the Gelao and Han populations (Fst = 0.0054 and 0.0052, respectively). The remaining population pairs showed comparatively low genetic differentiation, including the Tujia-Yi and Dong-Bouyei pairs. Figure 2 presents the UPGMA phylogenetic tree based on pairwise Fst values. The Guizhou Gelao population diverged earliest from the ancestral node, followed by the Bouyei and Dong populations, which formed a separate branch. Subsequent splits separated the Yi and Miao populations, while the Tujia and Han populations formed the most recent and closely related clade.
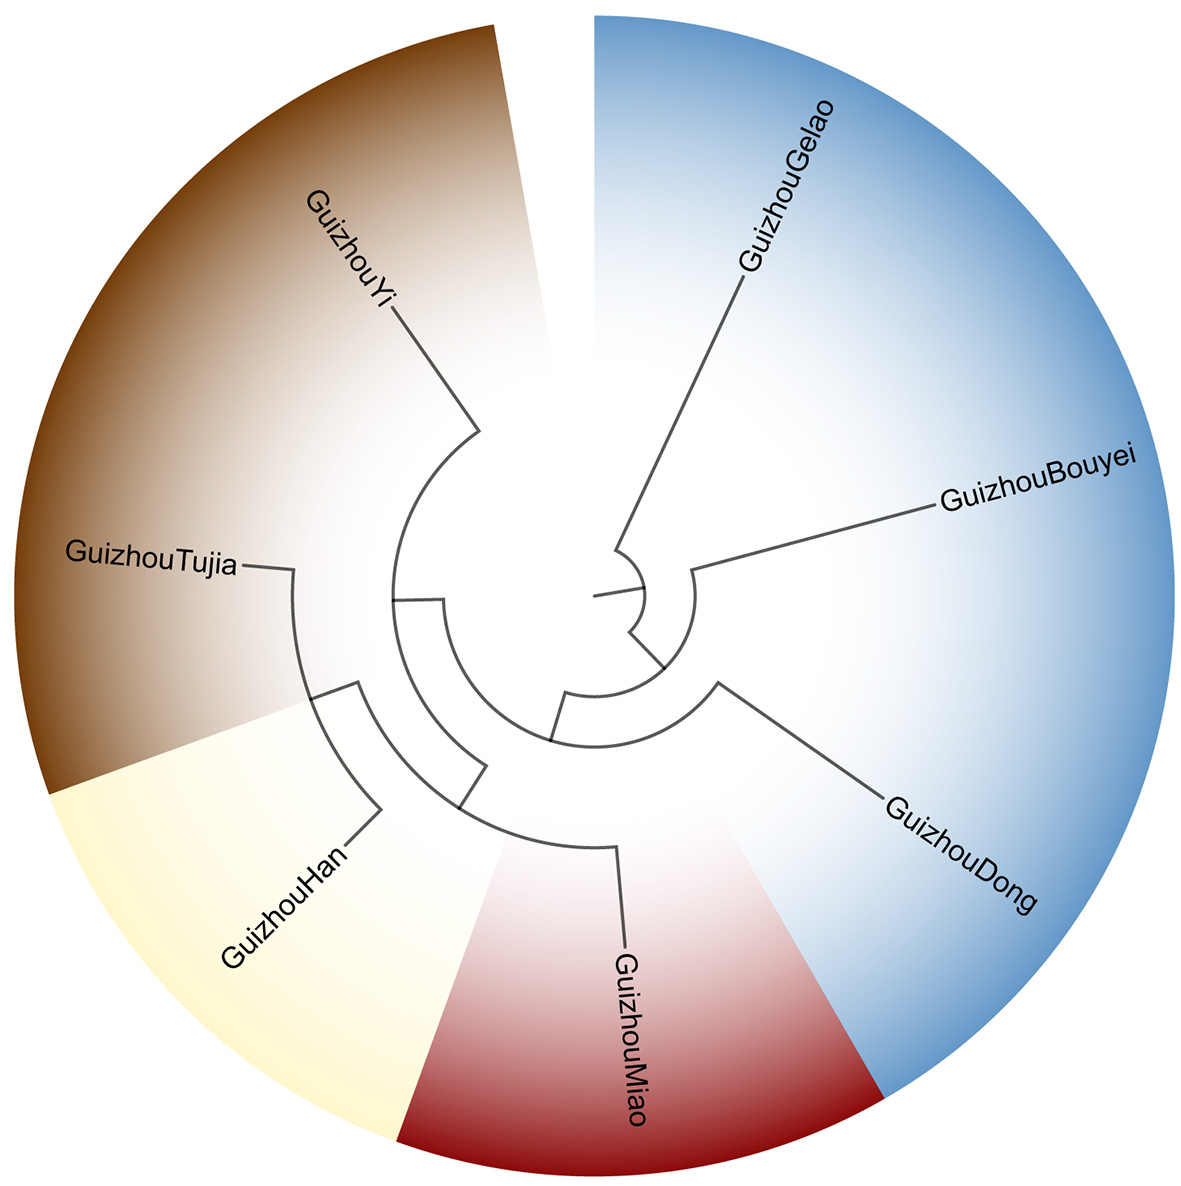
Figure 2. UPGMA phylogenetic tree illustrating genetic relationships among seven populations in Guizhou based on pairwise Fst values. The circular tree highlights clusters: Bouyei, Gelao, and Dong (blue); Miao (red); Han (yellow), Tujia, and Yi (brown), reflecting their genetic affinities.
Multidimensional scaling
MDS was conducted to visualize the genetic affinities of the seven Guizhou populations based on pairwise Fst values [Figure 3]. Along MDS1, the Han, Gelao, Dong, Yi, and Tujia populations clustered predominantly on the left side of the plot, while the Miao population was distinctly shifted to the right, indicating a marked separation from the other groups. Among MDS2, the Miao, Gelao, Tujia, and Yi populations occupied the lower region, contrasting with the Han, Dong, and Bouyei populations, which were positioned in the upper region. Overall, MDS effectively distinguished the Miao, Tujia, and Bouyei populations of Guizhou.
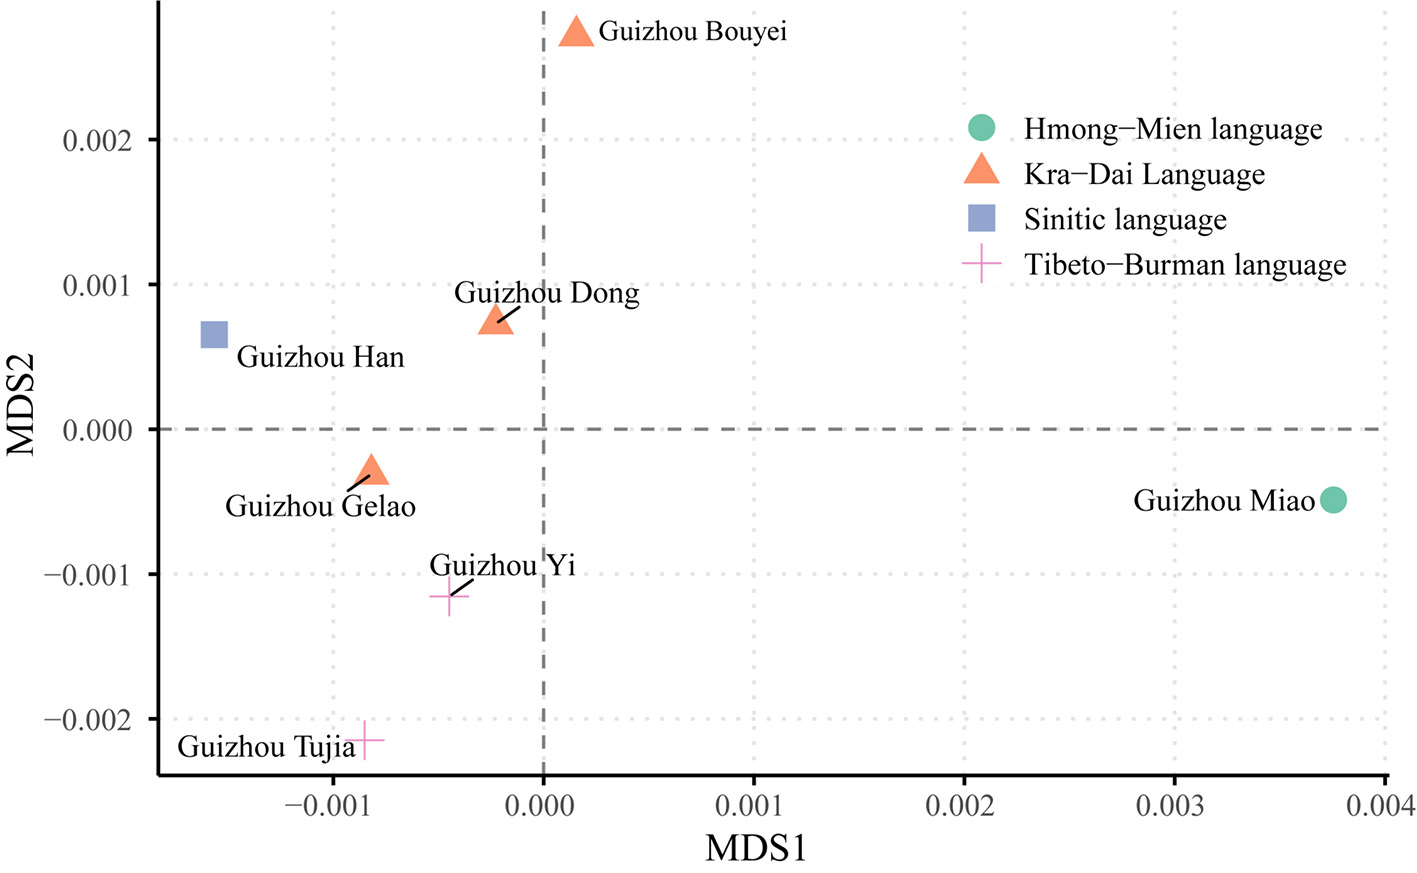
Figure 3. Multidimensional scaling depicting genetic relationships among the seven Guizhou populations based on pairwise Fst values. Different shapes and colors represent different language families: green circle for Hmong-Mien, orange triangle for Kra-Dai, blue square for Sinitic, and pink cross for Tibeto-Burman.
Principal component analysis
We performed PCA on these seven populations based on their haplotypic frequencies. The first two principal components accounted for 24.2% and 24.1% of the variance, respectively, with a cumulative contribution of 48.3%. As depicted in Figure 4, the Tibeto-Burman language group clustered together in the bottom-right quadrant. The Guizhou Miao population, representing the Hmong-Mien language family, was located in the top-right quadrant. The Kra-Dai language group exhibited a more dispersed distribution, similar to that observed in the MDS analysis. The Guizhou Han population occupied a central position in the plot. Overall, the Guizhou Gelao, Bouyei, and Miao populations were clearly distinguishable from one another.
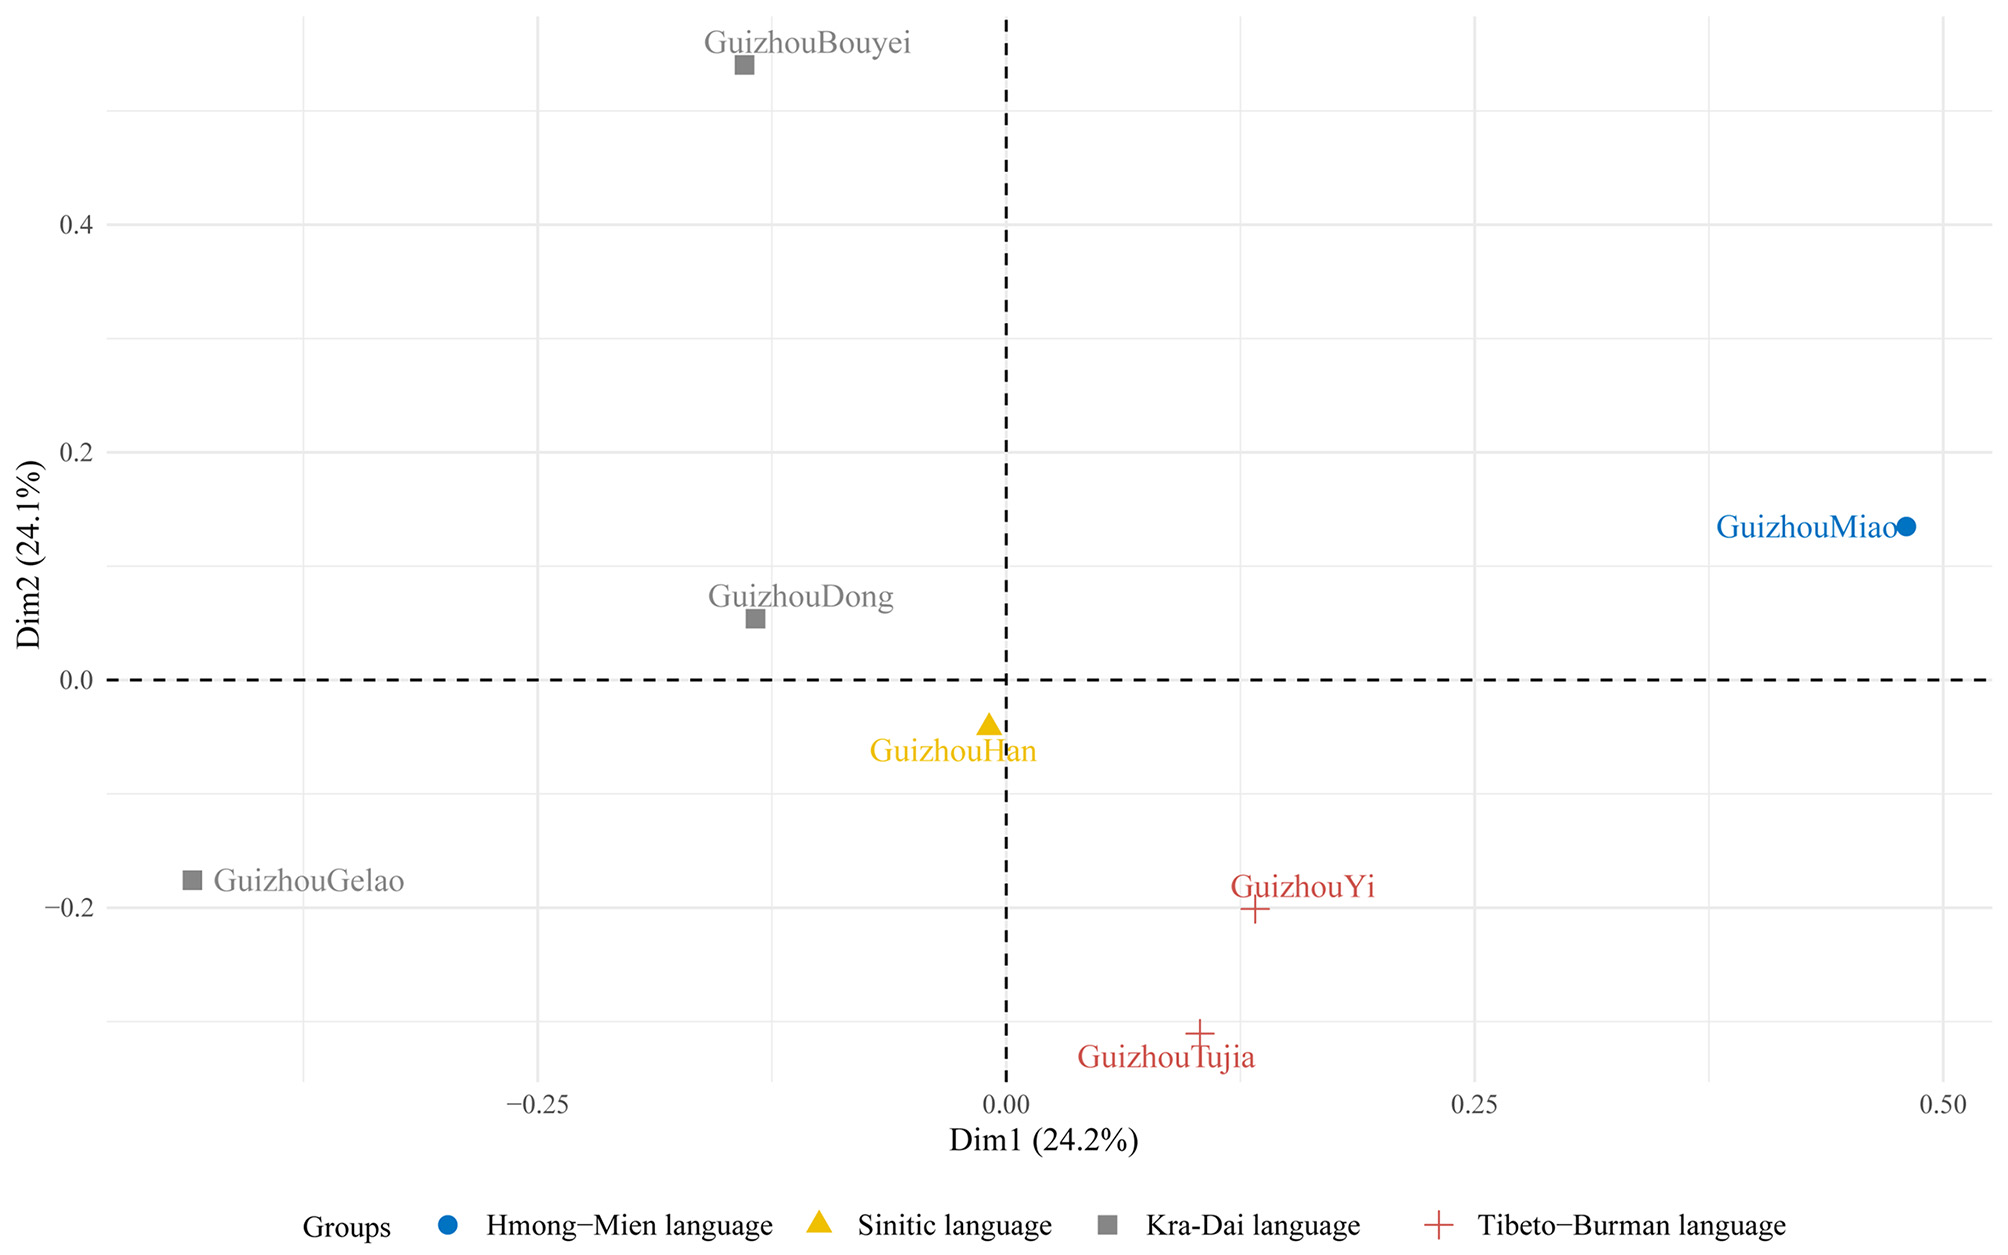
Figure 4. Principal component analysis of seven Guizhou populations based on 33 microhaplotypes. Different shapes and colors represent different language families: blue circle for Hmong-Mien, yellow triangle for Sinitic, gray square for Kra-Dai, and red cross for Tibeto-Burman.
Analysis of ancestral components
We further conducted population ancestral component analyses for the seven Guizhou populations, as shown in Supplementary Figure 1. At K = 2, the Miao population displayed a relatively low proportion of the orange component, whereas the other populations showed higher proportions, particularly the Han, Gelao, and Yi populations. At K = 3, divergences in ancestral components among the seven populations became more pronounced. However, at K = 4-5, the proportions of ancestry components did not differ substantially among populations. Analysis of the Delta K results [Supplementary Figure 2A] revealed a clear peak at K = 3. Meanwhile, the Mean LnP(K) distribution plateaued between K = 2 and K = 3
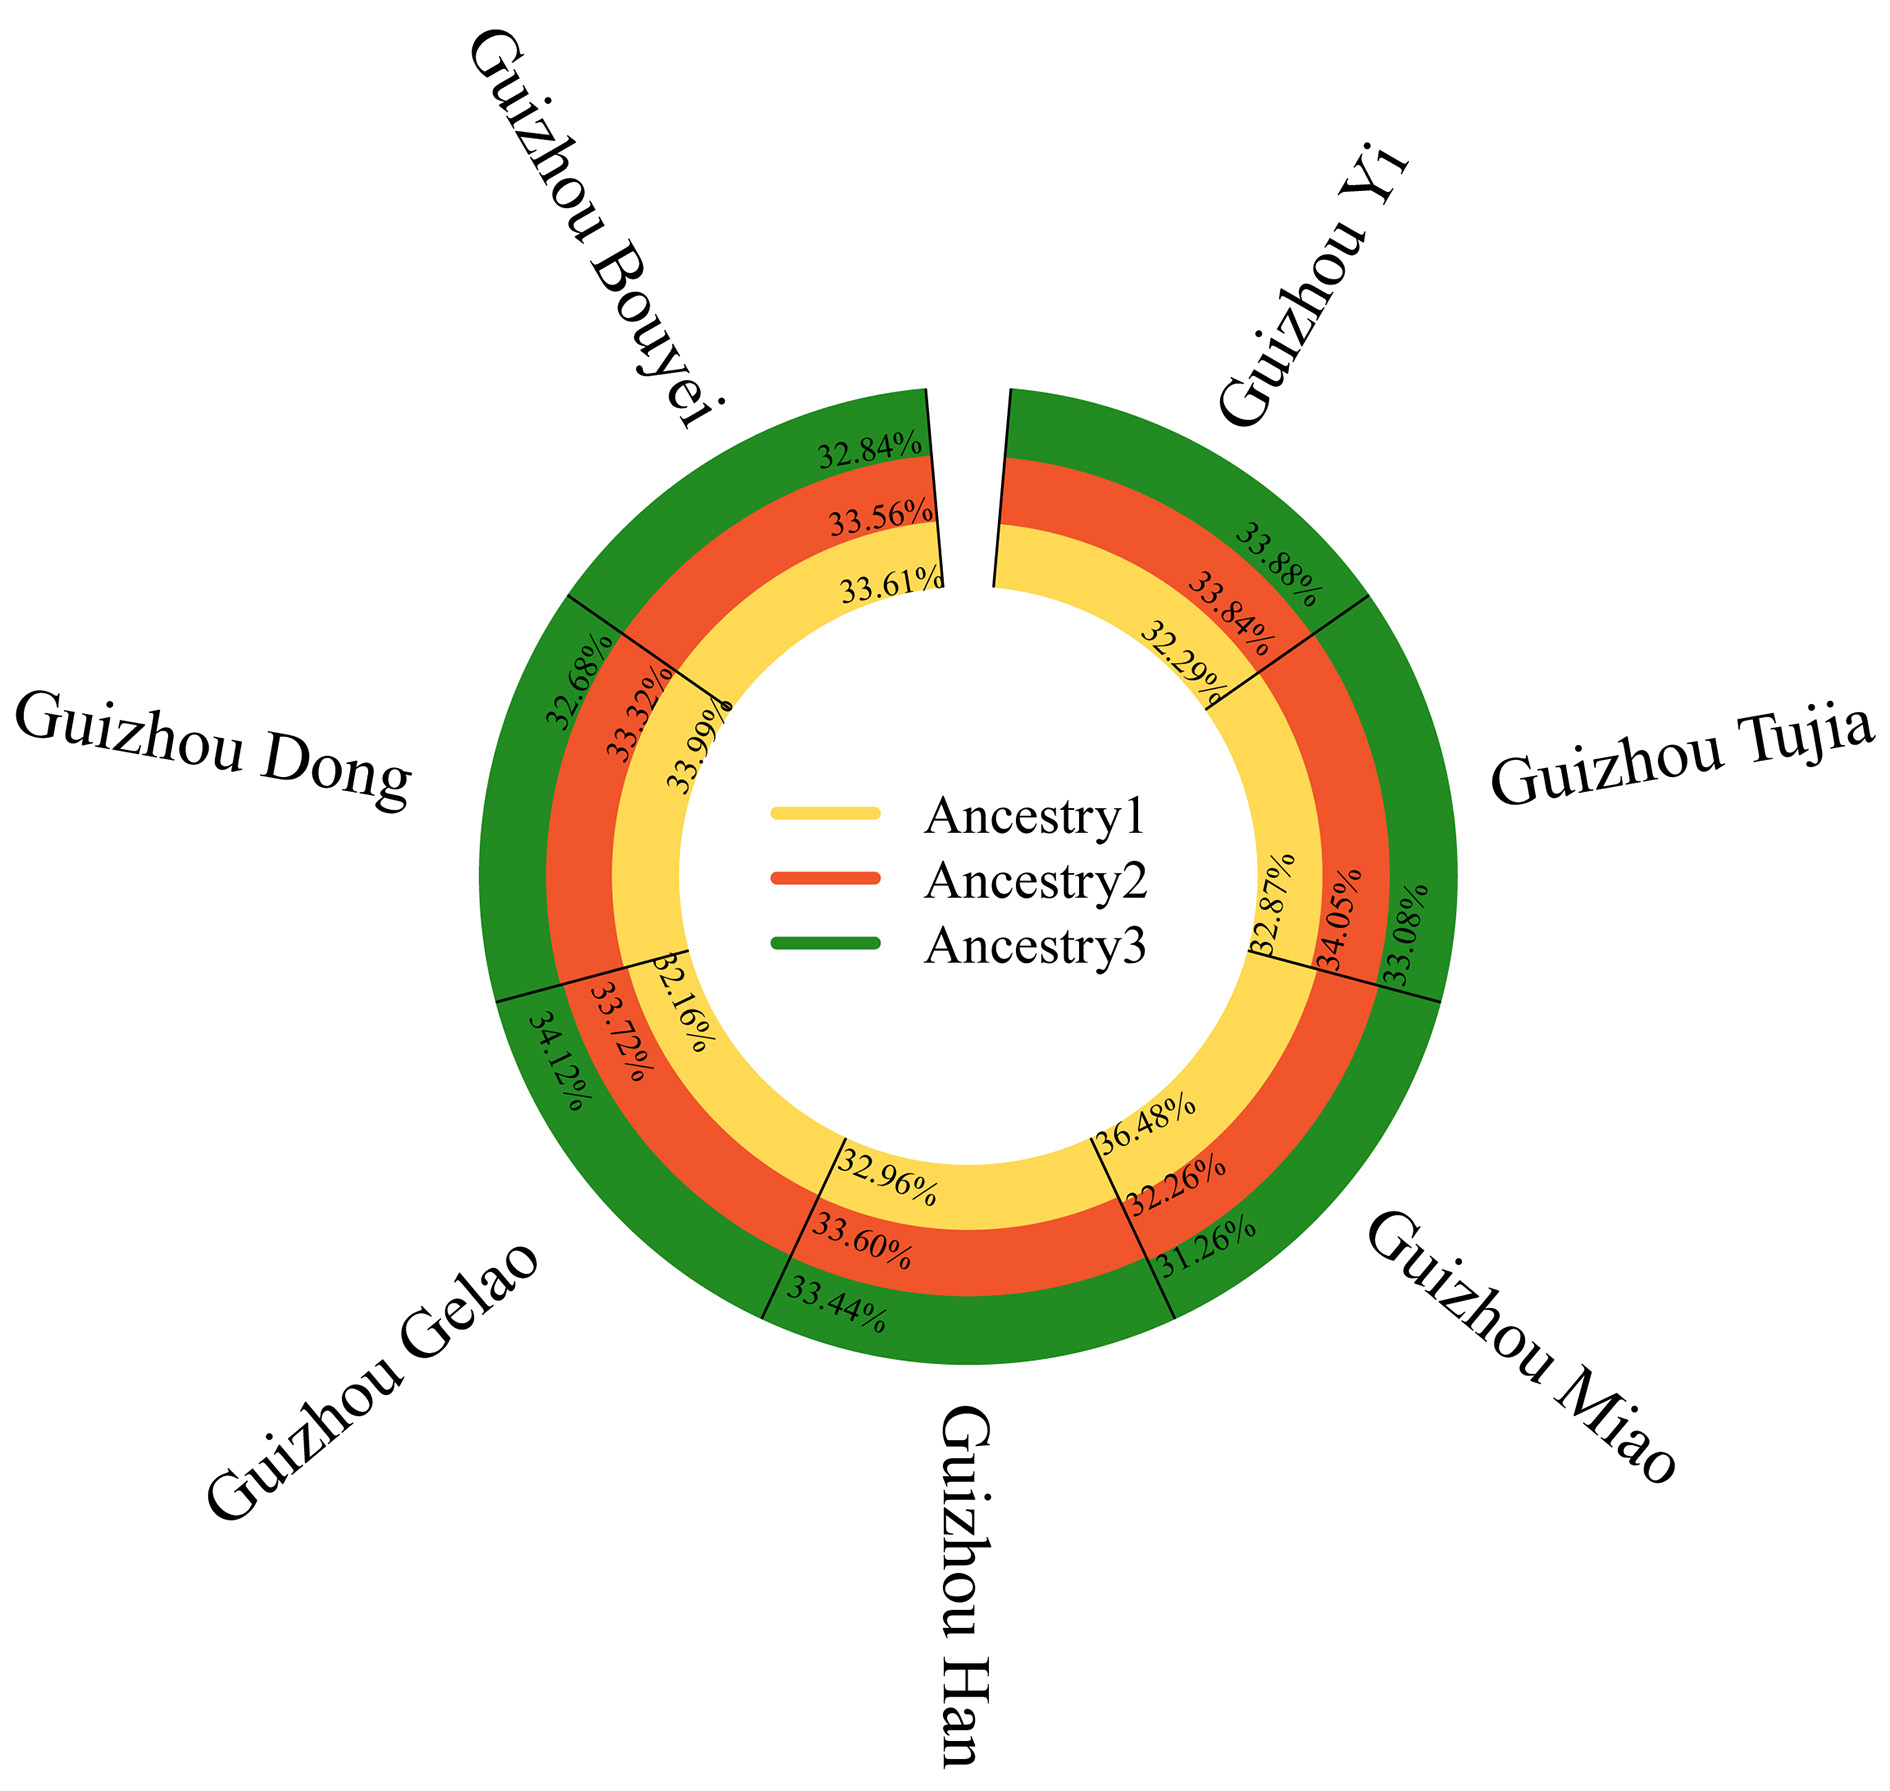
Figure 5. STRUCTURE analysis (K = 3) revealing genetic clusters among seven Guizhou populations. Ancestral components are color-coded as yellow (ancestry 1), red (ancestry 2), and green (ancestry 3), with the proportion of each component labeled for each population.
DISCUSSION
This study systematically evaluated the genetic diversity and population structure of seven ethnic groups in Guizhou using the 33-microhaplotype panel developed in our prior work. All 33 loci showed high genetic diversity and excellent forensic identification performance across the seven groups. Cumulative PD values for the Bouyei, Dong, Gelao, Tujia, Yi, Miao, and Han populations were 1-7.57E-38, 1-3.80E-38, 1-7.64E-38, 1-2.82E-38, 1-8.41E-39, 1-2.29E-39, and 1-5.63E-43, respectively; cumulative PE values were 1-1.78E-16, 1-1.94E-15, 1-4.62E-18, 1-2.39E-18, 1-3.32E-18, 1-2.44E-14, and 1-1.60E-15, respectively. Although some loci exhibited varying levels of polymorphism, the overall performance of the 33 loci was sufficient for forensic personal identification and kinship testing.
Using raw genotype and haplotype frequency data, we applied multiple analytical methods to elucidate the genetic relationships among the seven Guizhou populations. PCA and MDS analyses revealed that the Miao, Gelao, and Bouyei populations exhibited relatively independent distributions, with the Miao group displaying particularly pronounced divergence. Ancestral component analysis (K = 3) further revealed that the Miao population had different ancestral component distributions compared to the other groups: the yellow component accounted for 36.48%, the red for 32.26%, and the green for 31.26%. These findings align with Li et al.[38], who reported stronger genetic differentiation between Guizhou Miao populations and other ethnic groups. Moreover, Fst and DA analyses confirmed that the greatest genetic differentiation existed between the Miao and both the Gelao and Bouyei populations, likely reflecting the historical southwestern migration of the Miao. Their ancestors migrated from the middle and lower reaches of the Yellow and Yangtze Rivers to the Yunnan-Guizhou Plateau[4], and genetic drift during this migration may have contributed to their unique genetic characteristics. As suggested by Haber et al.[39], populations with shared ancestry or long-term gene flow develop specific component-sharing patterns due to genetic drift. The overall balance of ancestral components in our study supports this notion and indicates that frequent gene flow among Guizhou’s multi-ethnic populations has been shaped by the region’s relatively isolated settlement patterns and close cultural interactions.
The Bouyei, whose ancestors originated from the ancient "Baiyue", predominantly inhabit southern and southwestern Guizhou. Linguistic and demographic evidence suggested they share ancestry with the Zhuang people but have gradually formed an independent population due to long-term separation. The Gelao, primarily distributed in northern and central Guizhou, are among China’s oldest ethnic groups. A mitochondrial genetic study[7] found that the Gelao harbored a higher proportion of haplogroups specific to southern China. Nevertheless, in this study, the Gelao group showed genetic differentiation from other Guizhou populations, even those from the same language family. At K = 3, the Gelao population showed a higher proportion of the green ancestral component compared to the other populations
In summary, our results revealed subtle but meaningful genetic differentiation among Guizhou ethnic groups. All seven populations exhibited mixed distributions of three major ancestral components, with no group dominated by a single source, suggesting extensive historical gene flow. Although overall differentiation was low, the Miao population showed a distinctive ancestral component pattern and could be clearly separated from the others in both PCA and MDS analyses. In contrast, Bouyei, Gelao, Dong, Yi, Tujia, and Han populations showed broadly similar ancestral component distributions
DECLARATIONS
Authors’ contributions
Conducted statistical analysis and wrote the main manuscript: Gu C
Collected samples and performed experiment: Huang X, Ran Q, Pan S
Commented on the manuscript and provided valuable feedback: Ren Z, Wang Q, Liu Y, Yang M, Ji J
Designed the work and provided the conception: Zhang H, Jin X
All authors have read and agreed to the published version of the manuscript.
Availability of data and materials
The raw data and materials generated during this study are available from the corresponding author upon reasonable request. Interested readers should contact the corresponding author via email at 1115259825@qq.com, specifying the intended use and providing their institutional affiliation and contact information.
Financial support and sponsorship
This work was supported by the Guizhou Provincial Basic Research Program (Natural Science: ZK [2024] General 162), the Guizhou Medical University National Natural Science Foundation Cultivation Project (21NSFCP02), the National Natural Science Foundation [82160324], the Guizhou Innovation Training Program for College Students (S202310660094), and the Guizhou Province Graduate Student Scientific Research Project Fund (2024YJSKYJJ294).
Conflicts of interest
All authors declared that there are no conflicts of interest.
Ethical approval and consent to participate
The research adhered to the guidelines outlined in the Declaration of Helsinki. Informed consent was obtained from all individual participants included in the study. Additionally, this study was approved by the Ethics Committee of Guizhou Medical University (No. 2023-139).
Consent for publication
Not applicable.
Copyright
© The Author(s) 2025.
Supplementary Materials
REFERENCES
1. Ling F. The garrison system and the internalization of frontier areas in Guizhou during the ming dynasty. Jinan, Shandong: Shandong University; 2023. (In Chinese).
2. Yang Y, Hu J, Liu DJ, Li YJ, Hu Y, Hu SL. Patial differentiation and influencing factors of ethnic traditional villages in Guizhou province - based on six types of ethnic traditional villages. J Arid Land Resour Environ. 2022;36:178-85.
3. Zhao X. A study on karst settlement culture in Guizhou. J Guizhou Normal University (Natural Science Edition). 2010;28:104-8.
4. Tan H, Wang R, Wang CC. Fine-scale genetic profile and admixture history of two hmong-mien-speaking miao tribes from Southwest China inferred from genome-wide data. Hum Biol. 2021;93:179-99.
5. Zhang XX, Yu YQ, Tian W, et al. Single nucleotide polymorphism of 21 Y-chromosomal loci in seven ethnic minorities of kra-dai language in Guizhou province. Acta Sci Nat Univ Sunyatseni. 2020;59:125-32.
6. Sun H, Xu S, Long F, et al. Forensic and population genetic analysis of Han, Miao, Tujia and Gelao populations from Zunyi (Southwest China) on 15 autosomal short tandem repeat loci. Forensic Sci Int Genet. 2016;25:e20-1.
7. Liu C, Wang SY, Zhao M, et al. Mitochondrial DNA polymorphisms in Gelao ethnic group residing in Southwest China. Forensic Sci Int Genet. 2011;5:e4-10.
8. He Y, Ren LY, Shan KR, Zhang T, Wang CJ, Guan ZZ. Characterization of polymorphisms in the mitochondrial DNA of twelve ethnic groups in the Guizhou province of China. Mitochondrial DNA A DNA Mapp Seq Anal. 2016;27:365-70.
9. Kidd K, Pakstis A, Speed W, et al. Microhaplotype loci are a powerful new type of forensic marker. Forensic Sci Int Genet Suppl Ser. 2013;4:e123-4.
10. Oldoni F, Kidd KK, Podini D. Microhaplotypes in forensic genetics. Forensic Sci Int Genet. 2019;38:54-69.
11. Zhou J, Wang Y, Xu E. Research progress on application of microhaplotype in forensic genetics. Zhejiang Da Xue Xue Bao Yi Xue Ban. 2021;50:777-82.
12. Rodrigues P, Pinto N, Otterlund T, et al. Enhancing the potential of microhaplotypes for forensic applications: insights from afghan and somali populations. Genes. 2025;16:532.
13. Barros Rodrigues ML, Rodrigues MP, Norton HL, Mendes-Junior CT, Simões AL, Lawson DJ. Large-scale selection of highly informative microhaplotypes for ancestry inference and population specific informativeness. Forensic Sci Int Genet. 2025;74:103153.
14. Liu J, Su Y, Wen Y, et al. Massively parallel sequencing of 74 microhaplotypes and forensic characteristics in three Chinese Sino-Tibetan populations. Forensic Sci Int Genet. 2023;66:102905.
15. Oldoni F, Yoon L, Wootton SC, Lagacé R, Kidd KK, Podini D. Population genetic data of 74 microhaplotypes in four major U.S. population groups. Forensic Sci Int Genet. 2020;49:102398.
16. Kidd KK, Speed WC, Pakstis AJ, et al. Evaluating 130 microhaplotypes across a global set of 83 populations. Forensic Sci Int Genet. 2017;29:29-37.
17. Yang SB, Lee JE, Lee HY. Forensic genetic analysis of single-nucleotide polymorphisms and microhaplotypes in Koreans through next-generation sequencing using precision ID identity panel. Genes Genomics. 2023;45:1281-93.
18. Staadig A, Tillmar A. Evaluation of microhaplotypes in forensic kinship analysis from a Swedish population perspective. Int J Legal Med. 2021;135:1151-60.
19. Gao S, Wang Q, Gao Y, et al. Development and validation of a multiplex panel with 232 microhaplotypes and software for forensic kinship analysis. Forensic Sci Int Genet. 2025;76:103212.
20. Pakstis AJ, Gandotra N, Speed WC, Murtha M, Scharfe C, Kidd KK. The population genetics characteristics of a 90 locus panel of microhaplotypes. Hum Genet. 2021;140:1753-73.
21. Bulbul O, Pakstis AJ, Soundararajan U, et al. Ancestry inference of 96 population samples using microhaplotypes. Int J Legal Med. 2018;132:703-11.
22. Standage DS, Mitchell RN. MicroHapDB: a portable and extensible database of all published microhaplotype marker and frequency data. Front Genet. 2020;11:781.
23. Xue J, Tan M, Wu Q, et al. MHBase: a comprehensive database of short microhaplotypes for advancing forensic genetic analysis. Forensic Sci Int Genet. 2024;71:103062.
24. Gu C, Huo W, Huang X, et al. Developmental and validation of a novel small and high-efficient panel of microhaplotypes for forensic genetics by the next generation sequencing. BMC Genomics. 2024;25:958.
25. Bolger AM, Lohse M, Usadel B. Trimmomatic: a flexible trimmer for Illumina sequence data. Bioinformatics. 2014;30:2114-20.
26. Schneider VA, Graves-Lindsay T, Howe K, et al. Evaluation of GRCh38 and de novo haploid genome assemblies demonstrates the enduring quality of the reference assembly. Genome Res. 2017;27:849-64.
27. Guo Y, Dai Y, Yu H, Zhao S, Samuels DC, Shyr Y. Improvements and impacts of GRCh38 human reference on high throughput sequencing data analysis. Genomics. 2017;109:83-90.
28. Li H, Durbin R. Fast and accurate short read alignment with Burrows-Wheeler transform. Bioinformatics. 2009;25:1754-60.
29. Gouy A, Zieger M. STRAF-A convenient online tool for STR data evaluation in forensic genetics. Forensic Sci Int Genet. 2017;30:148-51.
30. Ota T. DISPAN: genetic distance and phylogenetic analysis. University Park, PA: Pennsylvania State University; 1993.
31. Rousset F. GENEPOP’007: a complete re-implementation of the genepop software for Windows and Linux. Mol Ecol Resour. 2008;8:103-6.
32. Tamura K, Dudley J, Nei M, Kumar S. MEGA4: Molecular Evolutionary Genetics Analysis (MEGA) software version 4.0. Mol Biol Evol. 2007;24:1596-9.
33. Falush D, Stephens M, Pritchard JK. Inference of population structure using multilocus genotype data: linked loci and correlated allele frequencies. Genetics. 2003;164:1567-87.
34. Earl DA, vonHoldt BM. Structure harvester: a website and program for visualizing STRUCTURE output and implementing the Evanno method. Conservation Genet Resour. 2012;4:359-61.
35. Jakobsson M, Rosenberg NA. CLUMPP: a cluster matching and permutation program for dealing with label switching and multimodality in analysis of population structure. Bioinformatics. 2007;23:1801-6.
36. Francis RM. Pophelper: an R package and web app to analyse and visualize population structure. Mol Ecol Resour. 2017;17:27-32.
37. Chen S, Lei C, Zhao X, Pan Y, Lu D, Xu S. AncestryPainter 2.0: visualizing ancestry composition and admixture history graph. Genome Biol Evol. 2024;16:evae249.
38. Li S, Zhang H, Luo L, Chen P. Comparative study of genetic relationships among seven ethnic groups in Guizhou province. J Zunyi Medical University. 2023;46:271-77.
39. Haber M, Doumet-Serhal C, Scheib C, et al. Continuity and admixture in the last five millennia of levantine history from ancient canaanite and present-day lebanese genome sequences. Am J Hum Genet. 2017;101:274-82.
40. Chen J, Zhang H, Yang M, et al. Genomic formation of tibeto-burman speaking populations in Guizhou, Southwest China. BMC Genomics. 2023;24:672.
41. Zhang Z, Zhang Y, Wang Y, et al. The tibetan-Yi region is both a corridor and a barrier for human gene flow. Cell Rep. 2022;39:110720.
42. Chen J, Wang M, Duan S, et al. Genetic history and biological adaptive landscape of the Tujia people inferred from shared haplotypes and alleles. Hum Genomics. 2024;18:104.
43. He G, Li Y, Wang M, et al. Fine-scale genetic structure of Tujia and central Han Chinese revealing massive genetic admixture under language borrowing. J Syst Evol. 2021;59:1-20.
44. Li K. A preliminary study on the origin of the Tujia ethnic group. Caizhi. 2013:1-248 (In Chinese). Available from: https://kns.cnki.net/kcms2/article/abstract?v=GWCpWhBv_VM2yu41sHLEX4ek55S1niqtfum6KXuOQrcR28V5qTH_Nht2WpXKPt94GLsBeb-uH4PPg_Hj42aPzSufx5-QR3ymFDkeur34Av_49EWe8orsWGOeoEjl8pSjRteQRiEbV8apGMbW4kiw7r5BnjaEZpSJ9R7aT3m1YcuVNpgFDe0Ktw==&uniplatform=NZKPT&language=CHS [Last accessed on 25 Aug 2025].
45. Zhao YB, Zhang Y, Zhang QC, et al. Ancient DNA reveals that the genetic structure of the northern Han Chinese was shaped prior to 3,000 years ago. PLoS One. 2015;10:e0125676.
46. Wen B, Li H, Lu D, et al. Genetic evidence supports demic diffusion of Han culture. Nature. 2004;431:302-5.
Cite This Article
How to Cite
Download Citation
Export Citation File:
Type of Import
Tips on Downloading Citation
Citation Manager File Format
Type of Import
Direct Import: When the Direct Import option is selected (the default state), a dialogue box will give you the option to Save or Open the downloaded citation data. Choosing Open will either launch your citation manager or give you a choice of applications with which to use the metadata. The Save option saves the file locally for later use.
Indirect Import: When the Indirect Import option is selected, the metadata is displayed and may be copied and pasted as needed.
About This Article
Copyright

Data & Comments
Data
0


Comments
Comments must be written in English. Spam, offensive content, impersonation, and private information will not be permitted. If any comment is reported and identified as inappropriate content by OAE staff, the comment will be removed without notice. If you have any queries or need any help, please contact us at support@oaepublish.com.