


fig2
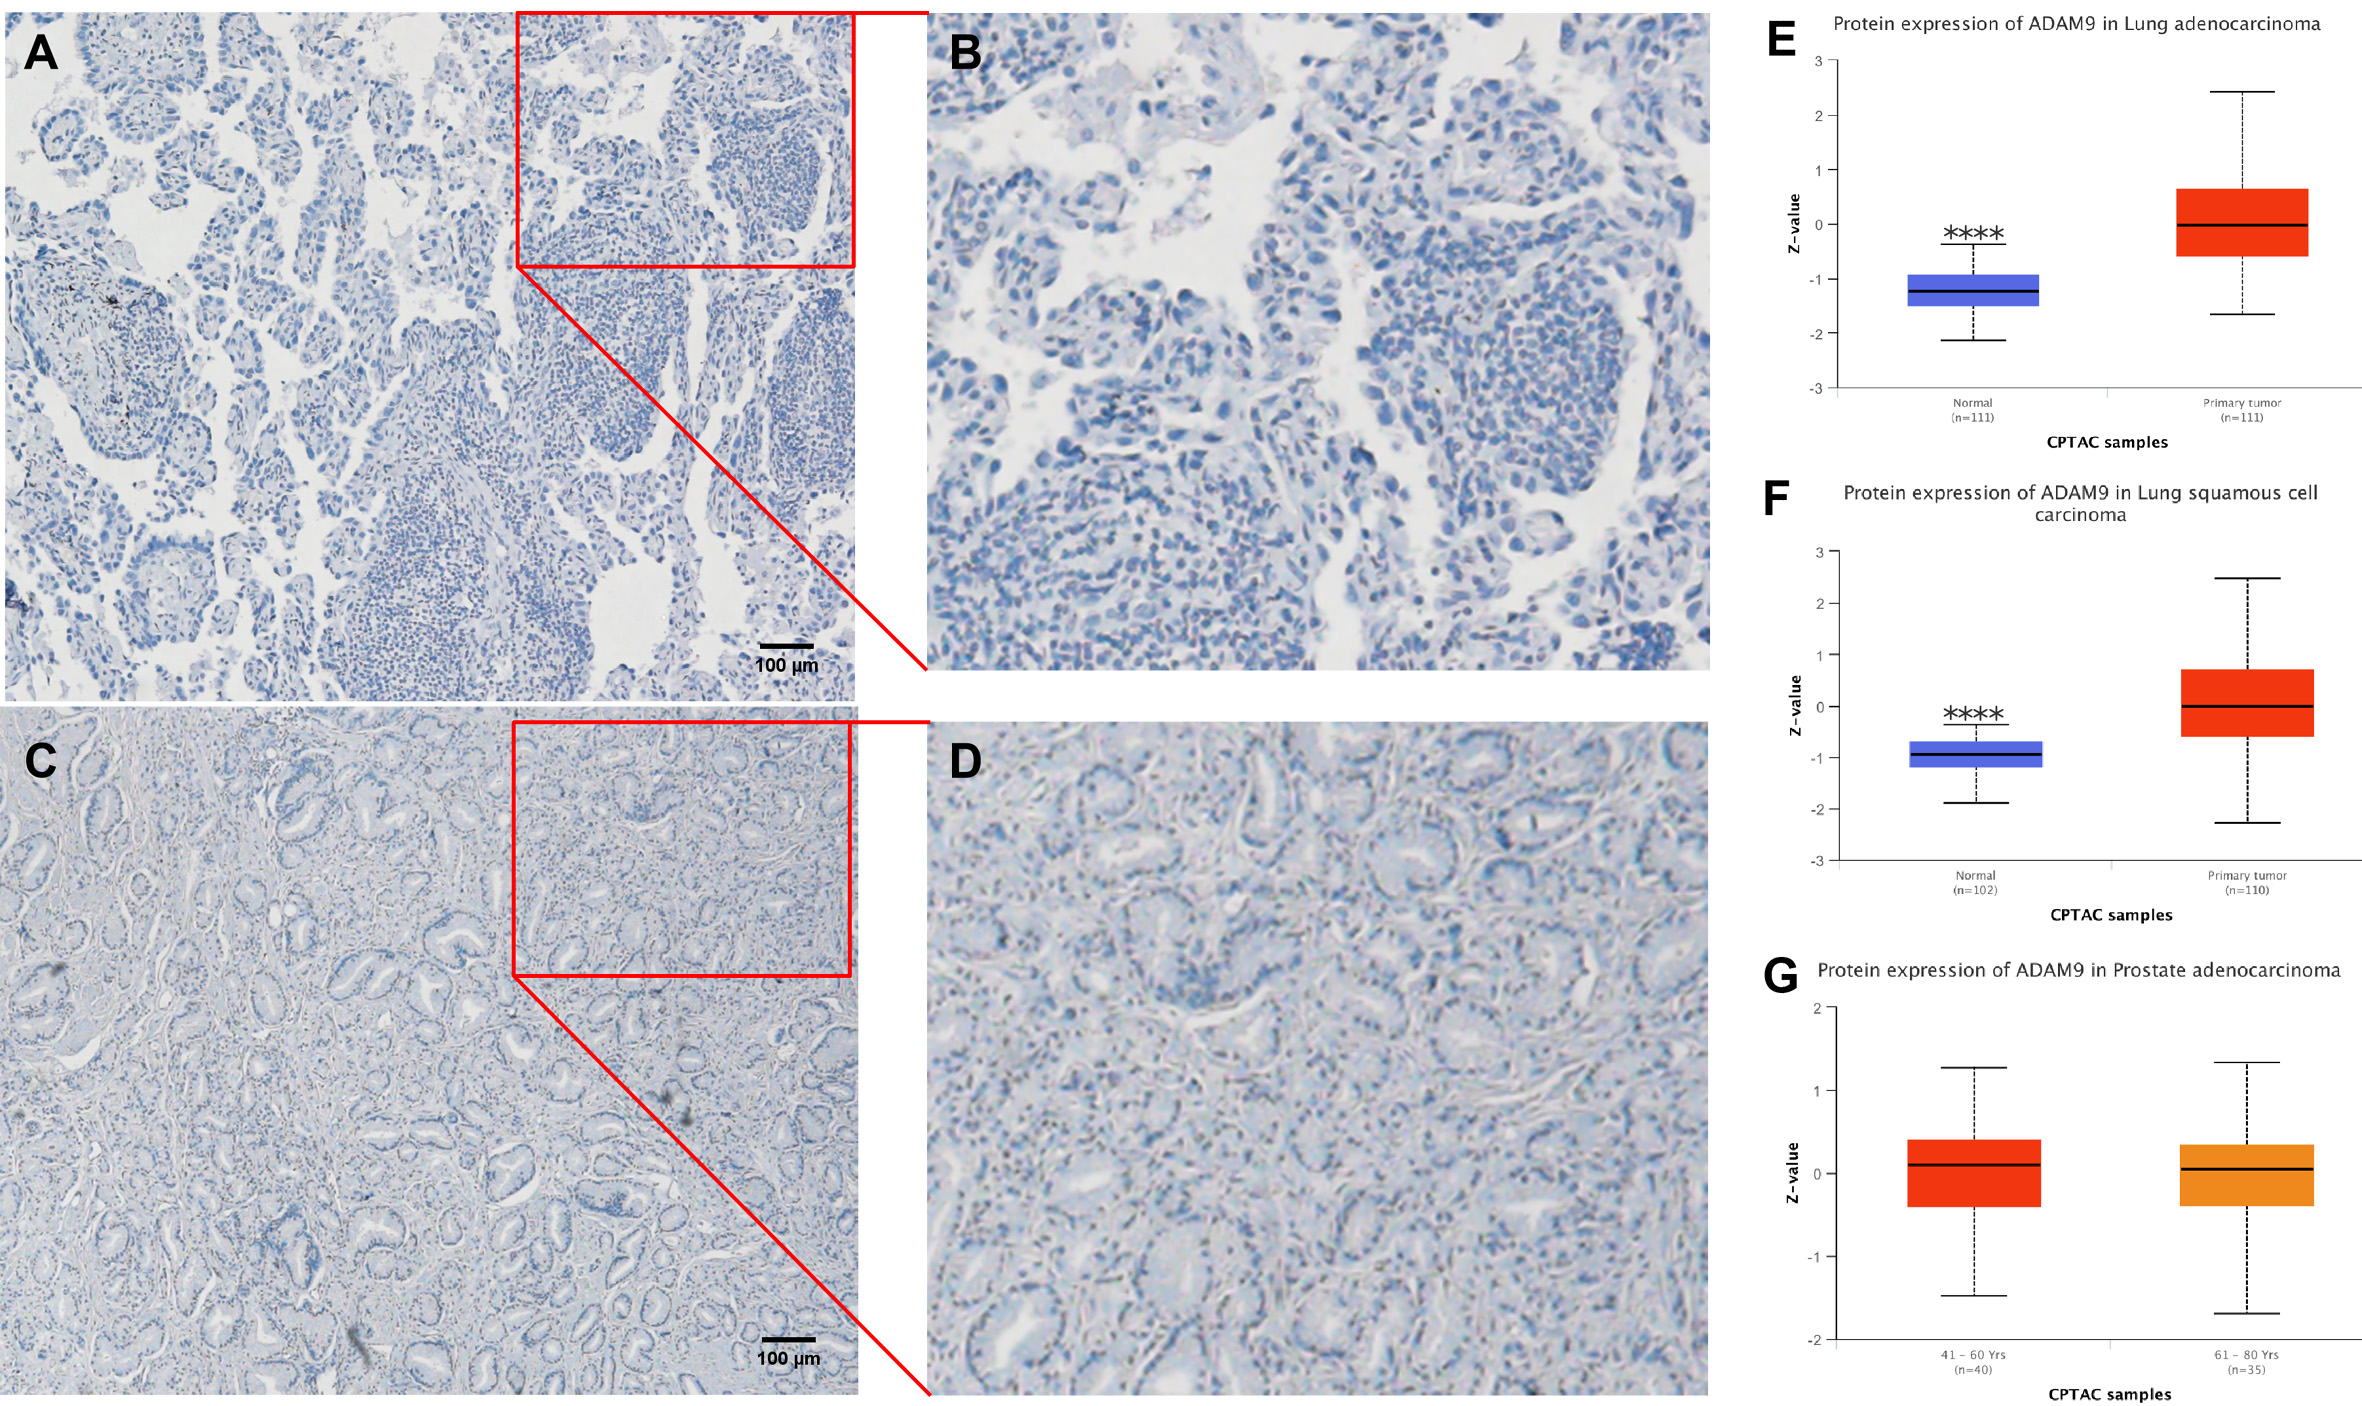
Figure 2. ADAM9 location and protein levels in cancer tissues from the lung and prostate. (A) Representative staining by IHC (immunohistochemistry) of Chinese lung adenocarcinoma (LUAD) tissues; (B) Enlarged picture of A; (C) Representative staining by IHC from a Chinese prostate cancer patient; (D) Magnified image of C; (E) Comparison of ADAM9 protein levels between lung adenocarcinoma (LUAD) and the corresponding matched normal tissues. P < 0.0001 (****); (F) Comparison of ADAM9 protein levels between lung squamous cell carcinoma (LUSC) and the corresponding matched normal tissues. P < 0.0001 (****); (G) Comparison of ADAM9 protein levels between prostate adenocarcinoma (PRAD) and the corresponding matched normal tissues. Images of A, B, C, and D magnified 100X.


