



fig4
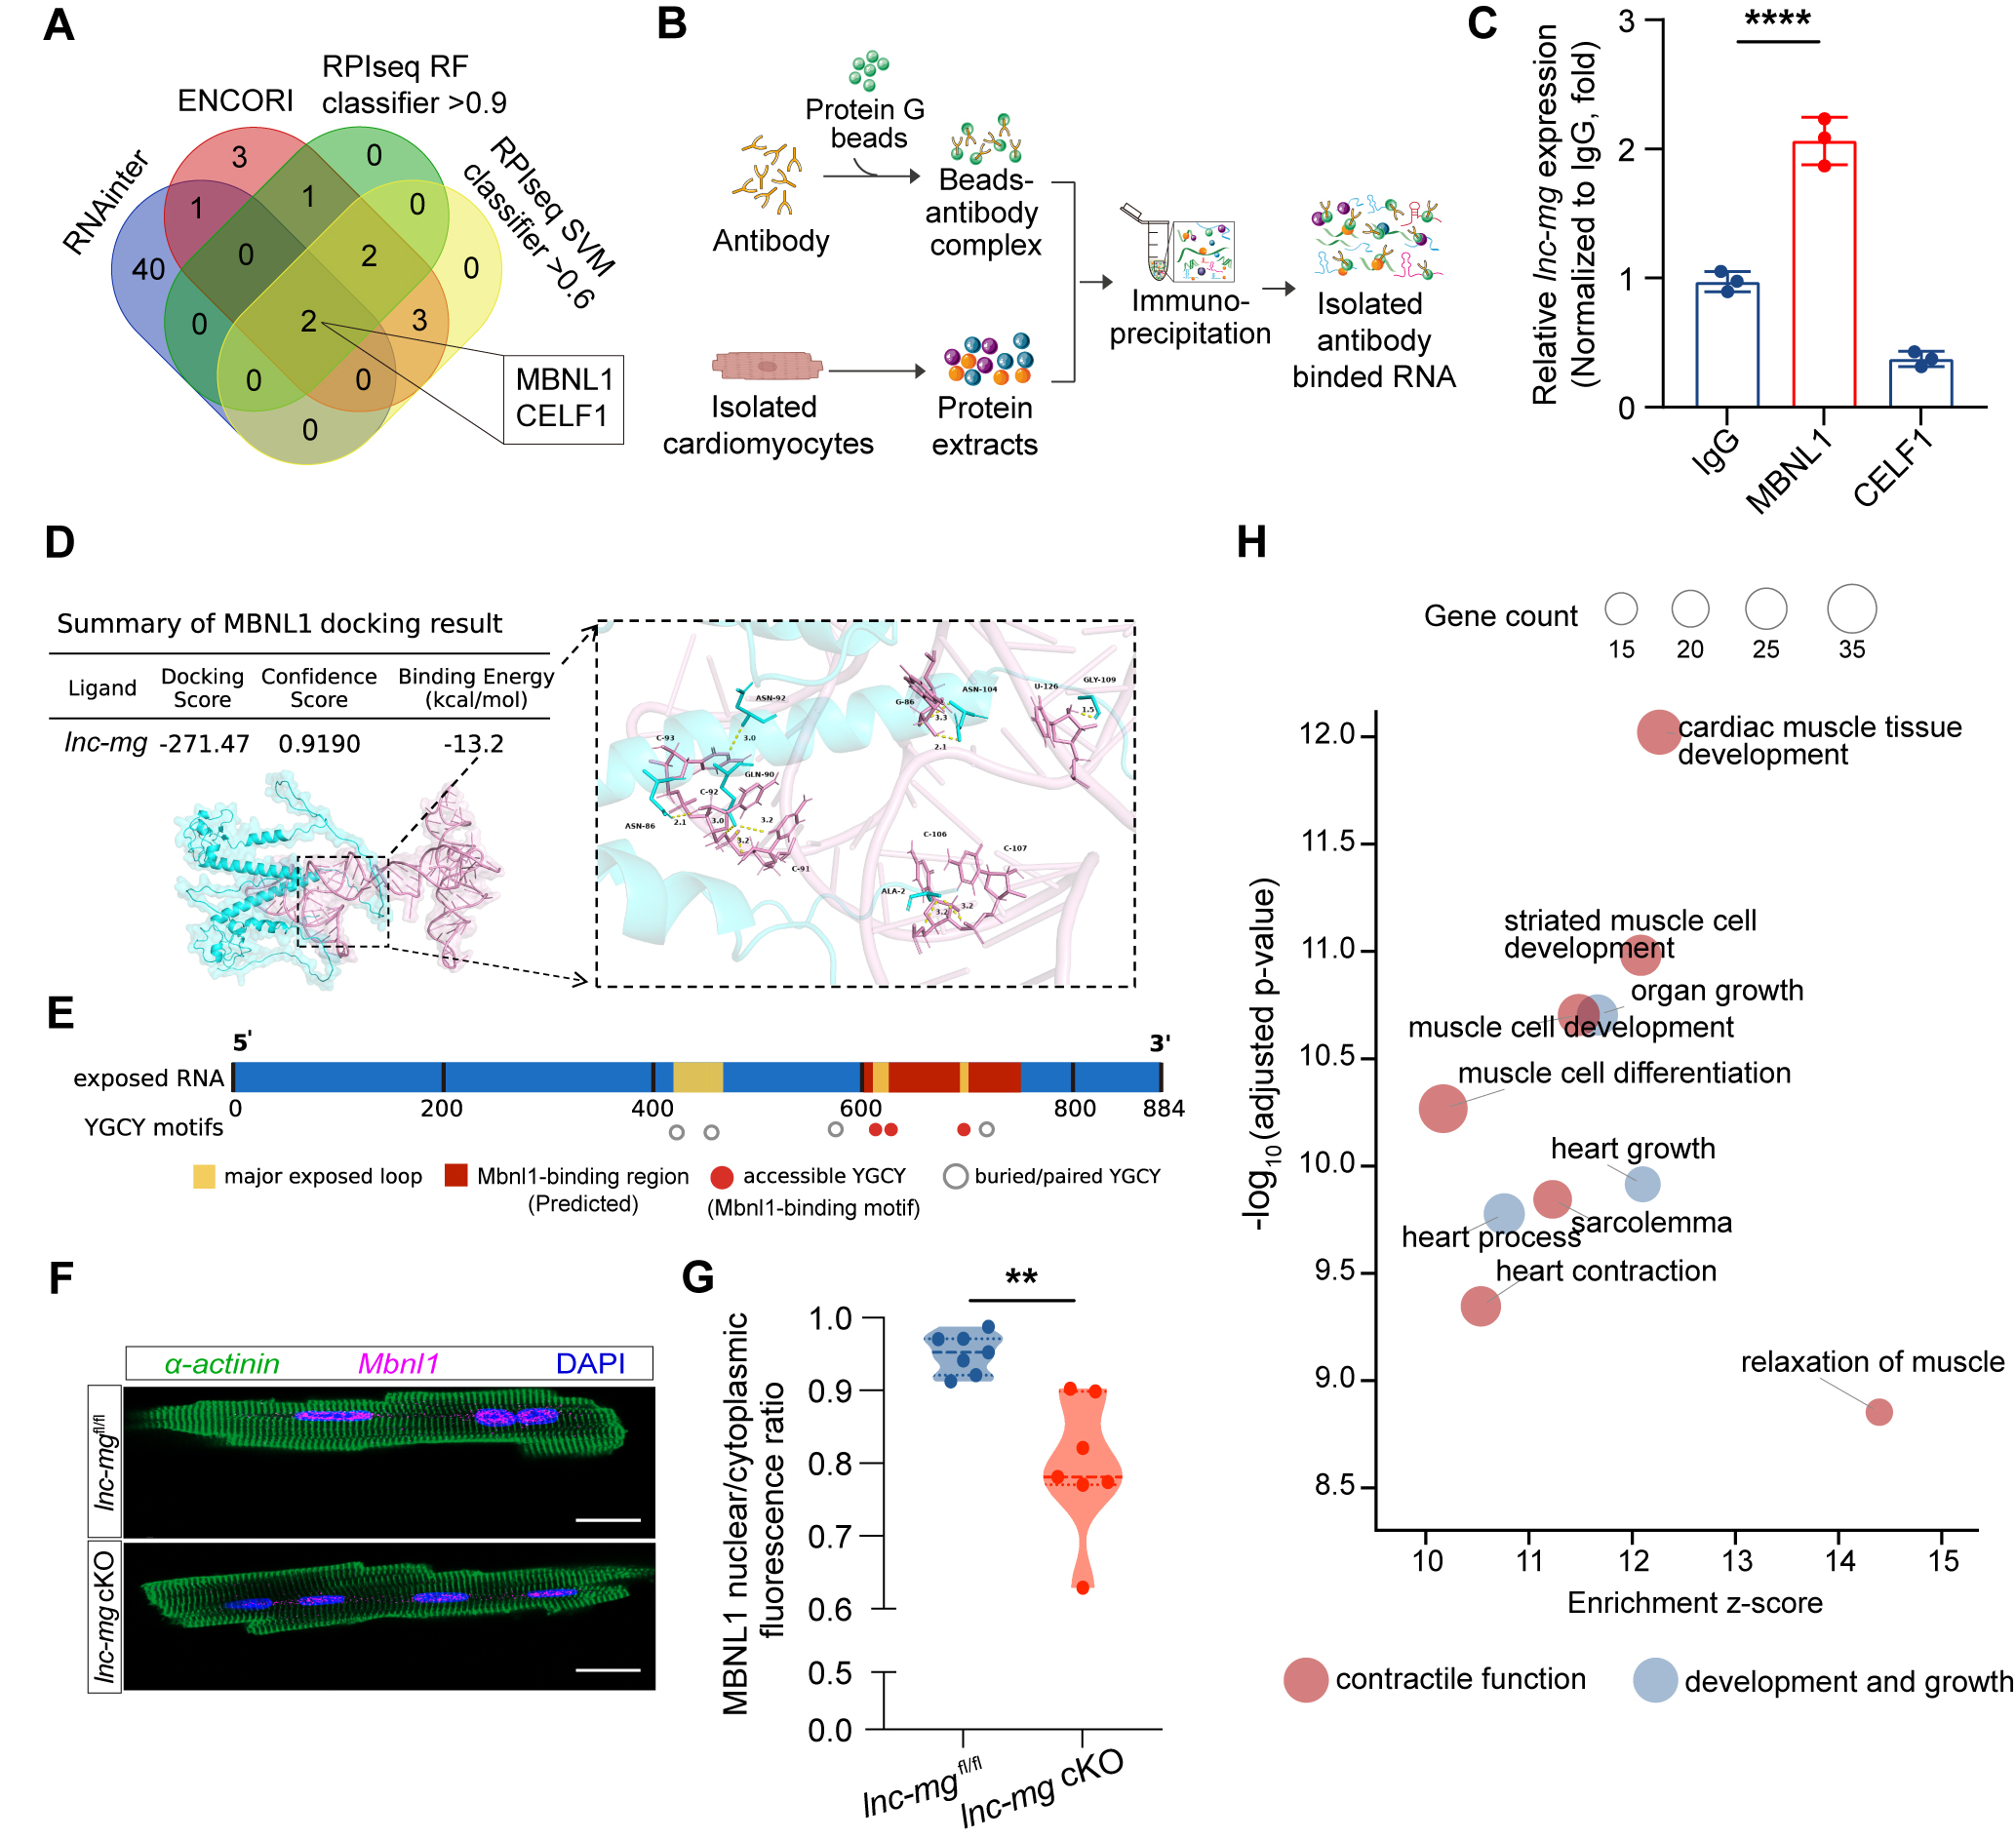
Figure 4. Lnc-mg is associated with MBNL1 and promotes its nuclear localization in cardiomyocytes. (A) Integrative prediction of lnc-mg-associated RNA-binding proteins using ENCORI, RNAInter, and RPISeq prediction platforms. (B) Schematic of the RNA immunoprecipitation (RIP) assay. Created in BioRender. Jia S, (2026) https://BioRender.com/cmx8vep. (C) RIP-qPCR analysis of lnc-mg enrichment following immunoprecipitation with IgG, MBNL1, or CELF1 antibodies from adult cardiomyocytes. Cardiomyocytes were obtained from three independent mice (n = 3 biological replicates). For each biological replicate, the same lysate preparation was divided among the IgG, MBNL1, and CELF1 immunoprecipitation conditions. (D) Predicted molecular docking model of a putative lnc-mg-MBNL1 complex, showing the docking score, confidence score, predicted binding energy, and an enlarged view of the predicted interaction interface with hydrogen-bond interactions. (E) Schematic of the predicted MBNL1-binding region and the distribution of canonical MBNL1 recognition motifs (YGCY) along the full-length lnc-mg transcript. (F) Representative immunofluorescence images showing MBNL1 subcellular localization in isolated adult cardiomyocytes from lnc-mgfl/fl and lnc-mg cKO mice. α-actinin (green), MBNL1 (magenta), and nuclei (DAPI, blue). Scale bar, 20 μm. (G) Quantification of the MBNL1 nuclear-to-cytoplasmic fluorescence intensity ratio in isolated adult cardiomyocytes. Fifty cardiomyocytes were analyzed from each of seven independent mice per group (n = 7 biological replicates per group). Measurements from the cardiomyocytes obtained from the same mouse were averaged to generate one mouse-level value. (H) GO enrichment analysis of MBNL1-bound transcripts identified from published heart MBNL1 CLIP-seq data. Bubble size represents gene count, and colors indicate functional categories. Data are presented as mean ± SEM. **P < 0.01; ****P < 0.0001.




