





fig3
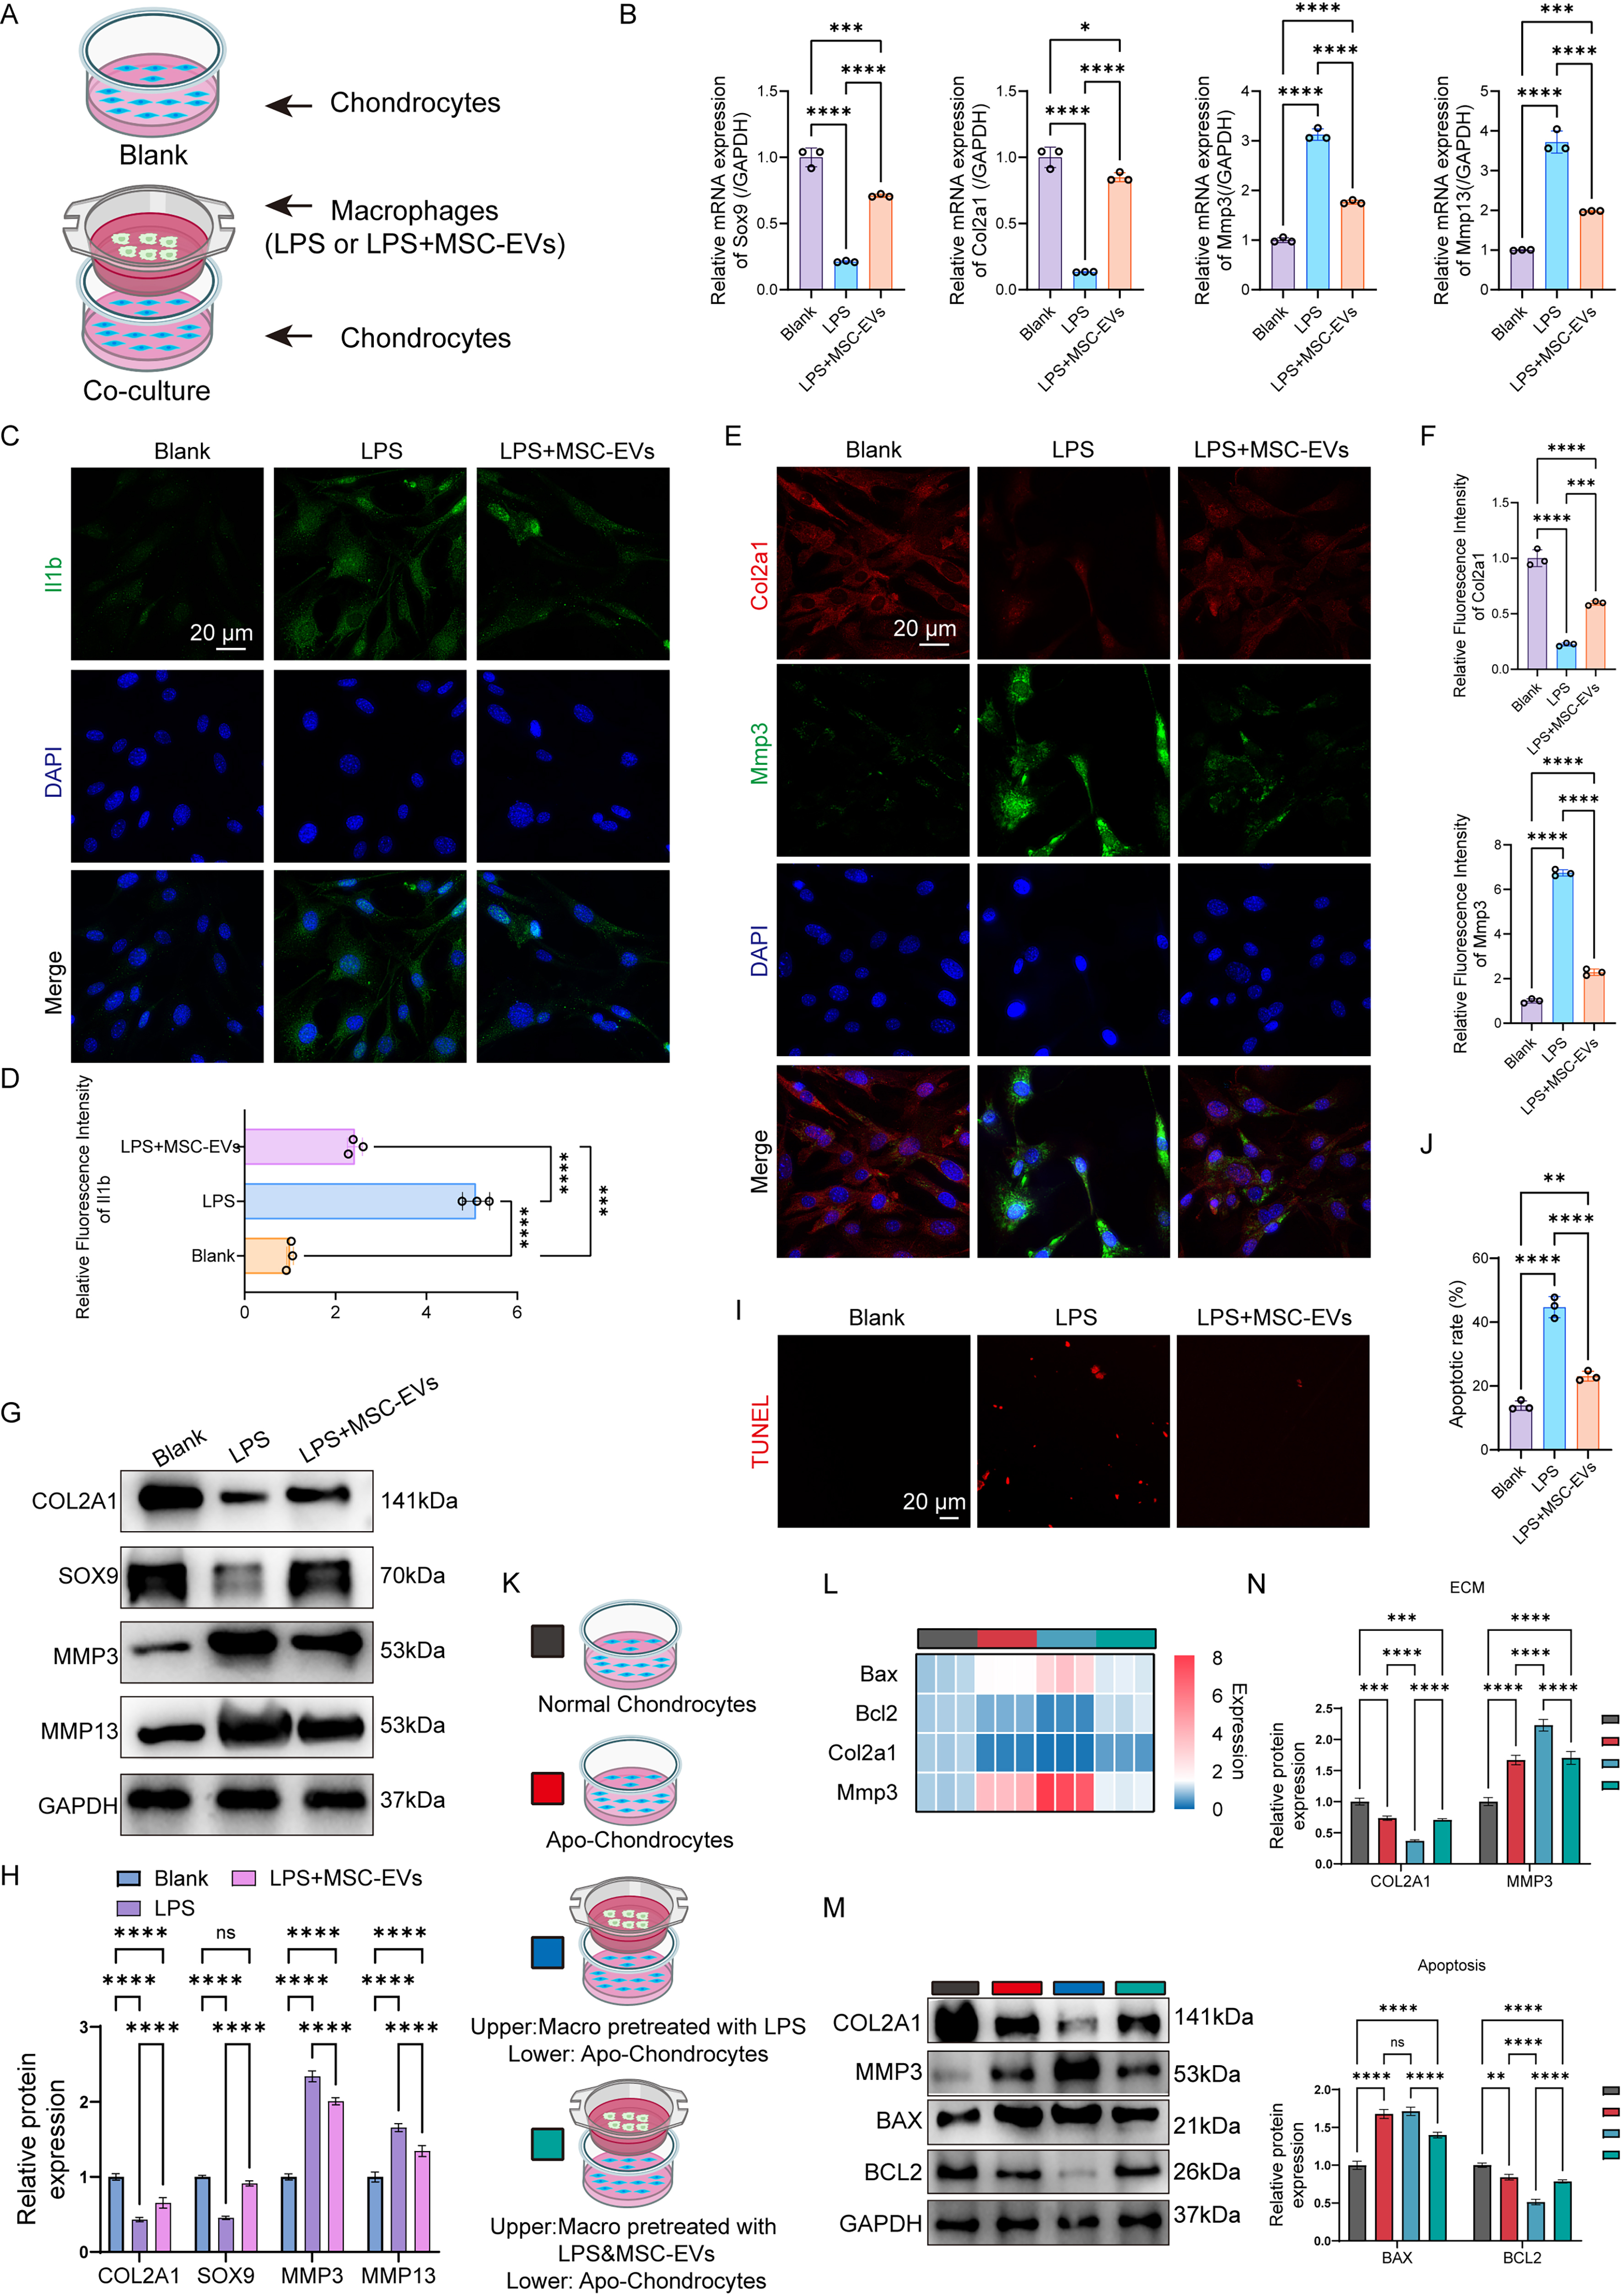
Figure 3. MSC-EV-induced enhancement of macrophage efferocytosis alleviates chondrocyte damage in vitro. (A) Illustration of the experiments to investigate the effects of macrophages treated with LPS (100 ng/mL) or MSC-EVs on chondrocytes; (B) Expression of ECM-associated genes was measured by RT-qPCR in chondrocytes co-cultured with macrophages exposed to LPS (100 ng/mL) or MSC-EVs (n = 3 independent biological experiments); (C) Representative immunofluorescence images showing Il1b expression in chondrocytes after co-culture with macrophages under the indicated treatments. Scale bar: 20 μm; (D) Quantitative assessment of Il1b expression in chondrocytes (n = 3 independent biological experiments); (E) Representative immunofluorescence images illustrating Col2a1 and Mmp3 expression in chondrocytes co-cultured with macrophages following LPS (100 ng/mL) or MSC-EV treatment. Scale bar: 20 μm; (F) Quantitative evaluation of Col2a1 and Mmp3 expression in chondrocytes (n = 3 independent biological experiments); (G) Representative Western blot images showing COL2A1, SOX9, MMP3, MMP13, and GAPDH protein levels in chondrocytes co-cultured with macrophages under the indicated experimental conditions; (H) Densitometric analysis of COL2A1, SOX9, MMP3, MMP13, and GAPDH protein expression (n = 3 independent biological experiments); (I) Representative TUNEL-stained images of chondrocytes following co-culture with macrophages treated with LPS (100 ng/mL) or MSC-EVs. Scale bar: 20 μm; (J) Quantitative analysis of TUNEL-positive chondrocytes (n = 3 independent biological experiments); (K) Schematic representation of the experimental design used to examine the effects of LPS- or MSC-EV-treated macrophages on normal and apoptotic chondrocytes; (L) Heat map showing the relative gene expression of Bax, Bcl2, Col2a1, and Mmp3 in chondrocytes; (M) Representative Western blot for COL2A1, BAX, MMP3, BCL2, and GAPDH in chondrocytes co-cultured with macrophages with varying treatments; (N) Quantification of COL2A1, BAX, MMP3, BCL2, and GAPDH in chondrocytes (n = 3 independent biological experiments). One-way ANOVA followed by Tukey’s multiple-comparison test was used for comparison in multiple groups (B), (D), (F), (H), (J) and (N). *P < 0.05, **P < 0.01, ***P < 0.001, ****P < 0.0001. (A) and (K) were created with BioRender.com. MSC-EVs: Mesenchymal stem cell-derived extracellular vesicles; LPS: lipopolysaccharide; ECM: extracellular matrix; RT-qPCR: quantitative real-time polymerase chain reaction; TUNEL: terminal deoxynucleotidyl transferase-mediated dUTP nick end labeling; GAPDH: glyceraldehyde-3-phosphate dehydrogenase; ANOVA: analysis of variance.