





fig1
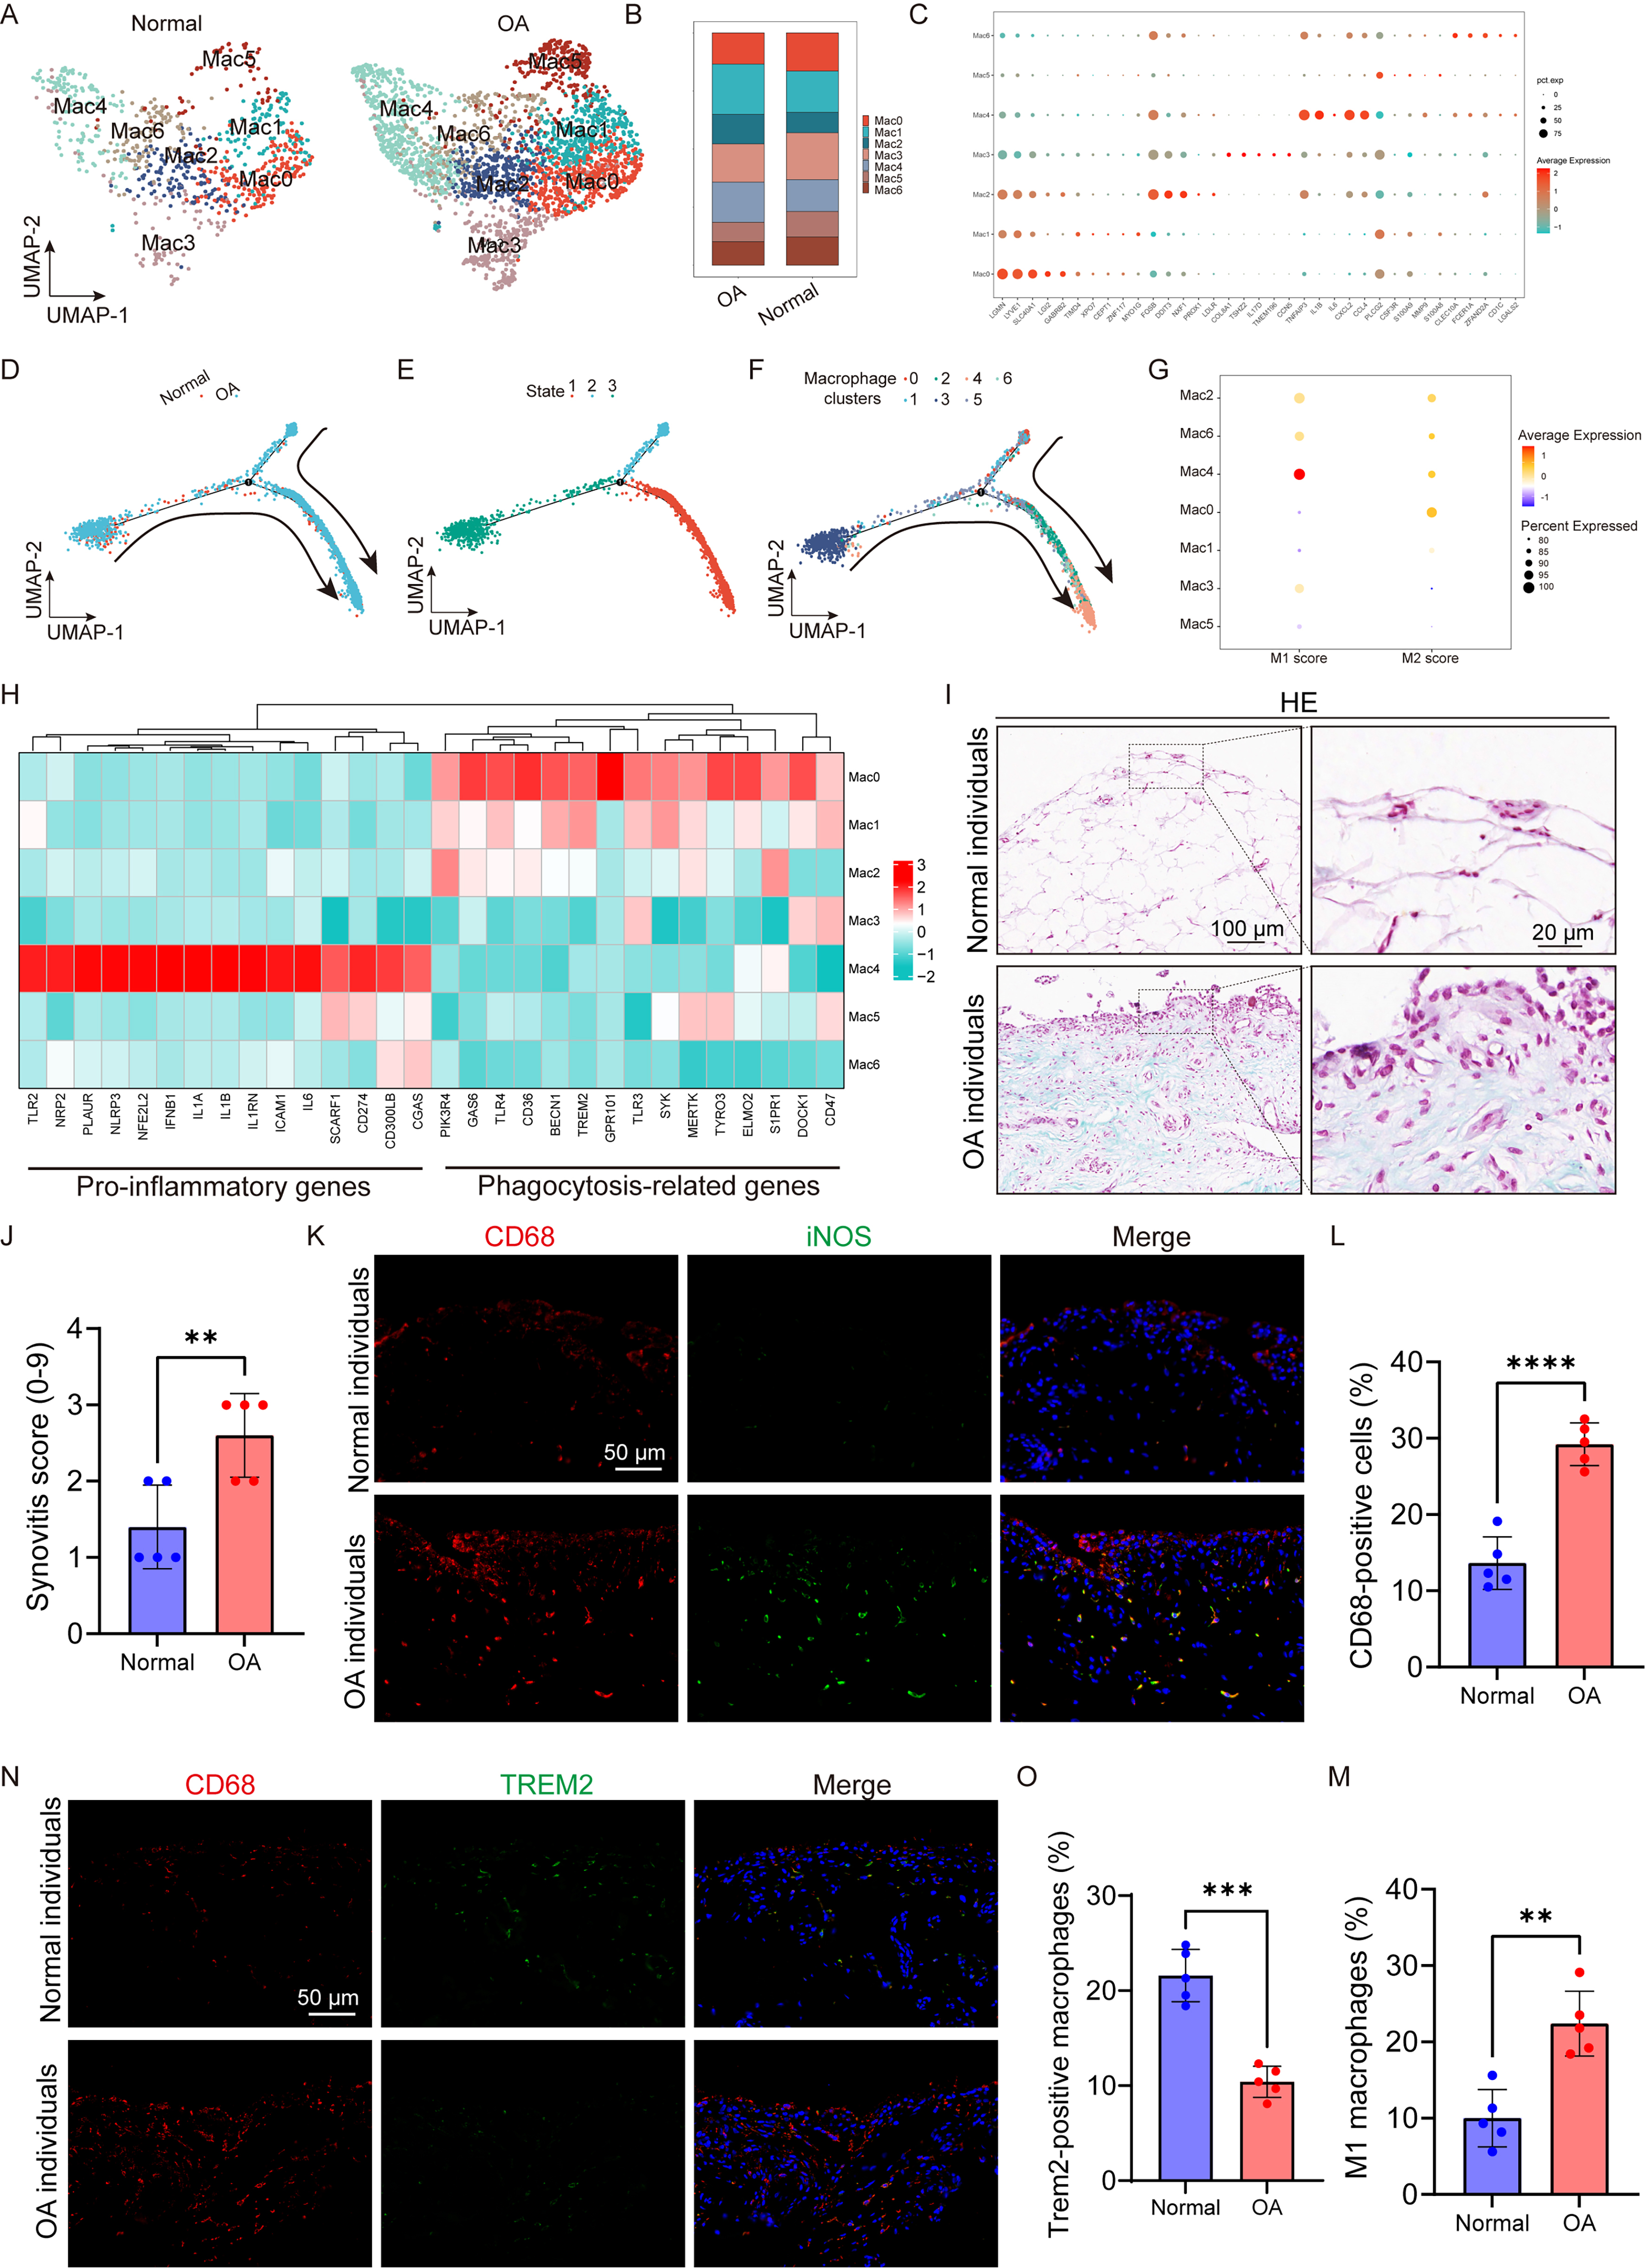
Figure 1. Impaired macrophage efferocytosis and inflammation activation during OA development. (A) UMAP plot showing seven macrophage populations (Mac0-Mac6) obtained by unsupervised clustering of macrophages from the human articular cartilage and meniscus scRNA-seq dataset GSE220243. Each dot represents one cell and is colored according to cluster identity; (B) Distribution of the seven macrophage subsets in normal and OA samples; (C) Dot plot illustrating representative marker genes for each macrophage subset. Dot size denotes the percentage of cells expressing the indicated gene, whereas color intensity indicates the relative expression level; (D-F) Pseudotime trajectory analysis depicting macrophage transitions according to cluster identity and inferred differentiation state. Mac4 cells were mainly enriched at the terminal region of the trajectory; (G) Comparison of macrophage subcluster gene signatures with canonical M1- and M2-associated transcriptional programs. Bubble size reflects the proportion of differentially expressed genes contributing to enrichment, and color indicates the direction and FDR significance of enrichment (red denotes enrichment of upregulated genes, whereas blue denotes enrichment of downregulated genes); (H) Heatmaps displaying the expression patterns of pro-inflammatory and phagocytosis/efferocytosis-associated genes across macrophage subsets, with tile color representing relative expression abundance; (I and J) Representative H&E-stained sections of human synovium and corresponding synovitis scores in normal and OA groups (n = 5 independent human donors per group). Scale bars: 20 and 100 µm; (K) Representative immunofluorescence images of CD68 and iNOS expression in normal and OA human synovial tissues. Scale bar: 50 µm; (L and M) Quantification of CD68-positive macrophages and iNOS-positive pro-inflammatory macrophages, respectively (n = 5 independent human donors per group); (N) Representative immunofluorescence images showing CD68 and TREM2 staining in normal and OA human synovial tissues. Scale bar: 50 µm; (O) Quantification of TREM2-positive macrophages (n = 5 independent human donors per group). Statistical analysis was performed using an unpaired Student’s t-test for (L), (M), and (O), and the Mann-Whitney U test for (J). *P < 0.05, **P < 0.01, ***P < 0.001, ****P < 0.0001. OA: Osteoarthritis; UMAP: uniform manifold approximation and projection; scRNA-seq: single-cell RNA sequencing; FDR: false discovery rate; H&E: hematoxylin and eosin; iNOS: inducible nitric oxide synthase; TREM2: triggering receptor expressed on myeloid cells 2.