





fig6
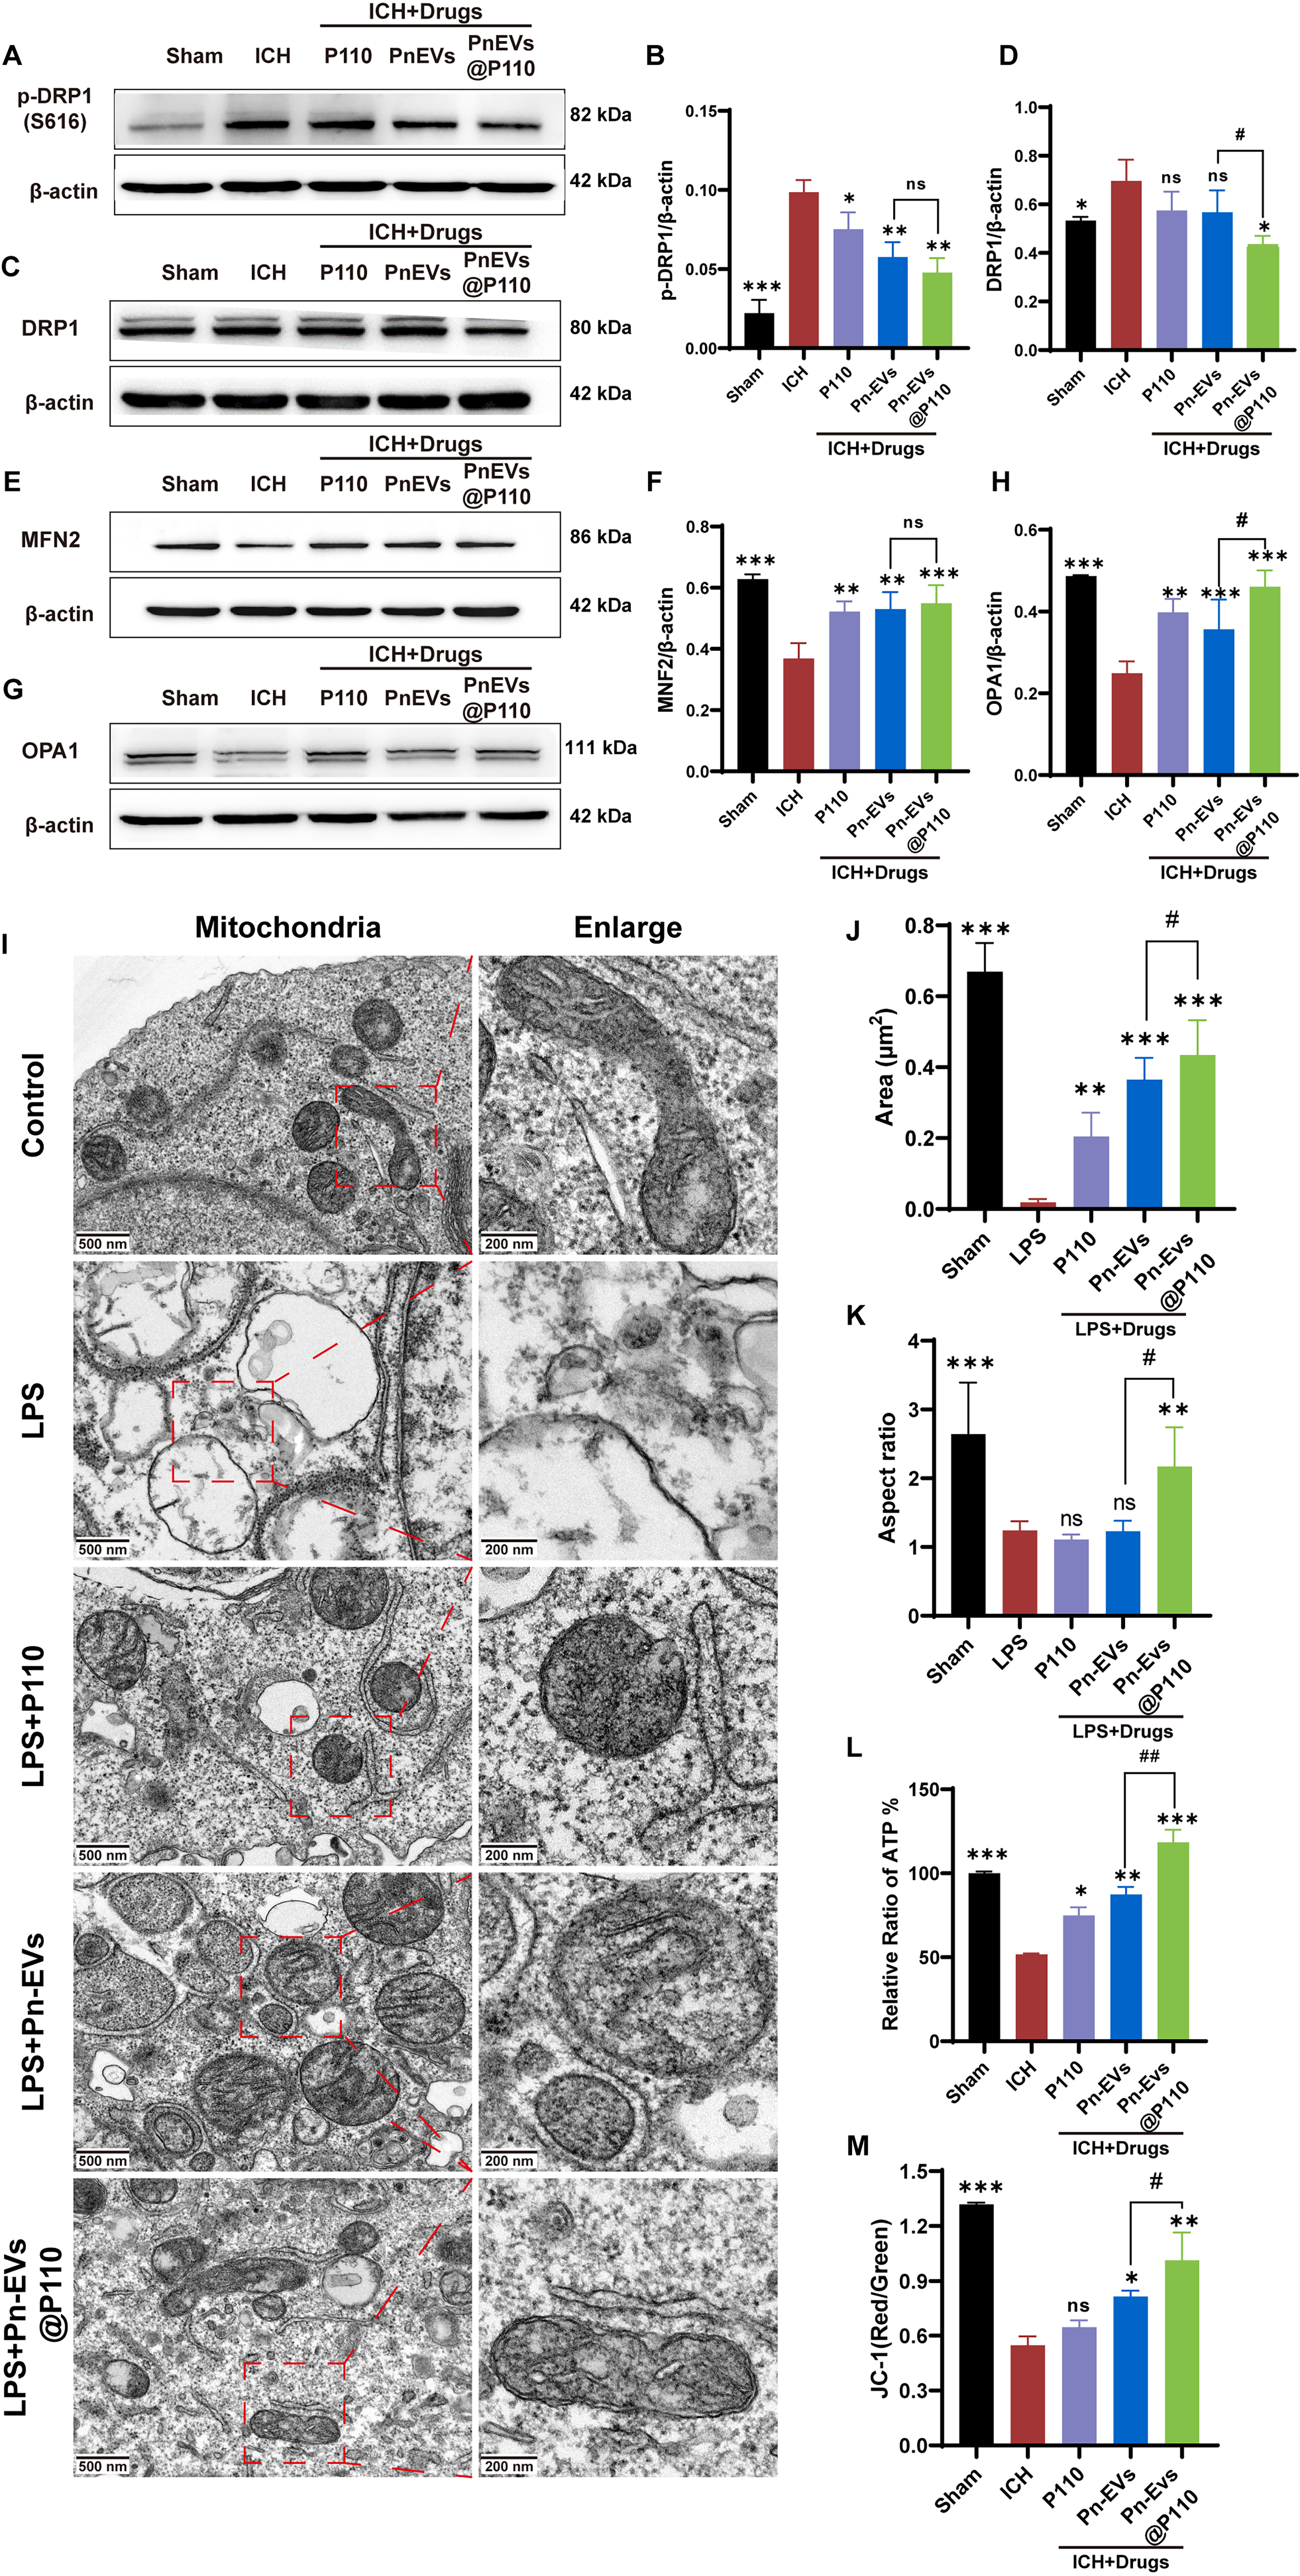
Figure 6. Pn-EVs@P110 restores mitochondrial dynamics and function by inhibiting excessive fission (in vivo and in vitro). (A, C, E, and G) Representative Western blots of mitochondrial fission/fusion-related proteins in perihematomal tissue, including p-Drp1 (S616), Drp1, MFN2, and OPA1 (β-actin as loading control); (B, D, F, and H) Densitometric quantification of corresponding protein levels normalized to β-actin; (I) Representative TEM images of mitochondria in BV2 cells under control or LPS stimulation with indicated treatments (P110, Pn-EVs, Pn-EVs@P110). Boxes indicate regions shown at higher magnification; (J and K) Quantification of mitochondrial morphology parameters (area and aspect ratio) based on TEM images; (L) Intracellular ATP levels in BV2 cells under indicated conditions; (M) Mitochondrial membrane potential assessed by JC-1 red/green ratio. Data are presented as mean ± SD. For (A-H), n = 3 mice/group; for I-M, data were obtained from three independent biological experiments (n = 3). *P < 0.05, **P < 0.01, ***P < 0.001 vs. ICH (or LPS, as appropriate); #P < 0.05, ##P < 0.01, ###P < 0.001 vs. Pn-EVs or P110 as indicated by the brackets. p-Drp1: Phosphorylated dynamin-related protein 1; Drp1: dynamin-related protein 1; MFN2: mitofusin 2; OPA1: optic atrophy 1; TEM: transmission electron microscopy; LPS: lipopolysaccharide; ATP: adenosine triphosphate; JC-1: 5,5’,6,6’-tetrachloro-1,1’,3,3’-tetraethylbenzimidazolylcarbocyanine iodide; Pn-EVs: Panax notoginseng-derived extracellular vesicle-like nanovesicles; ICH: intracerebral hemorrhage; SD: standard deviation; ns: not significant.




