





fig5
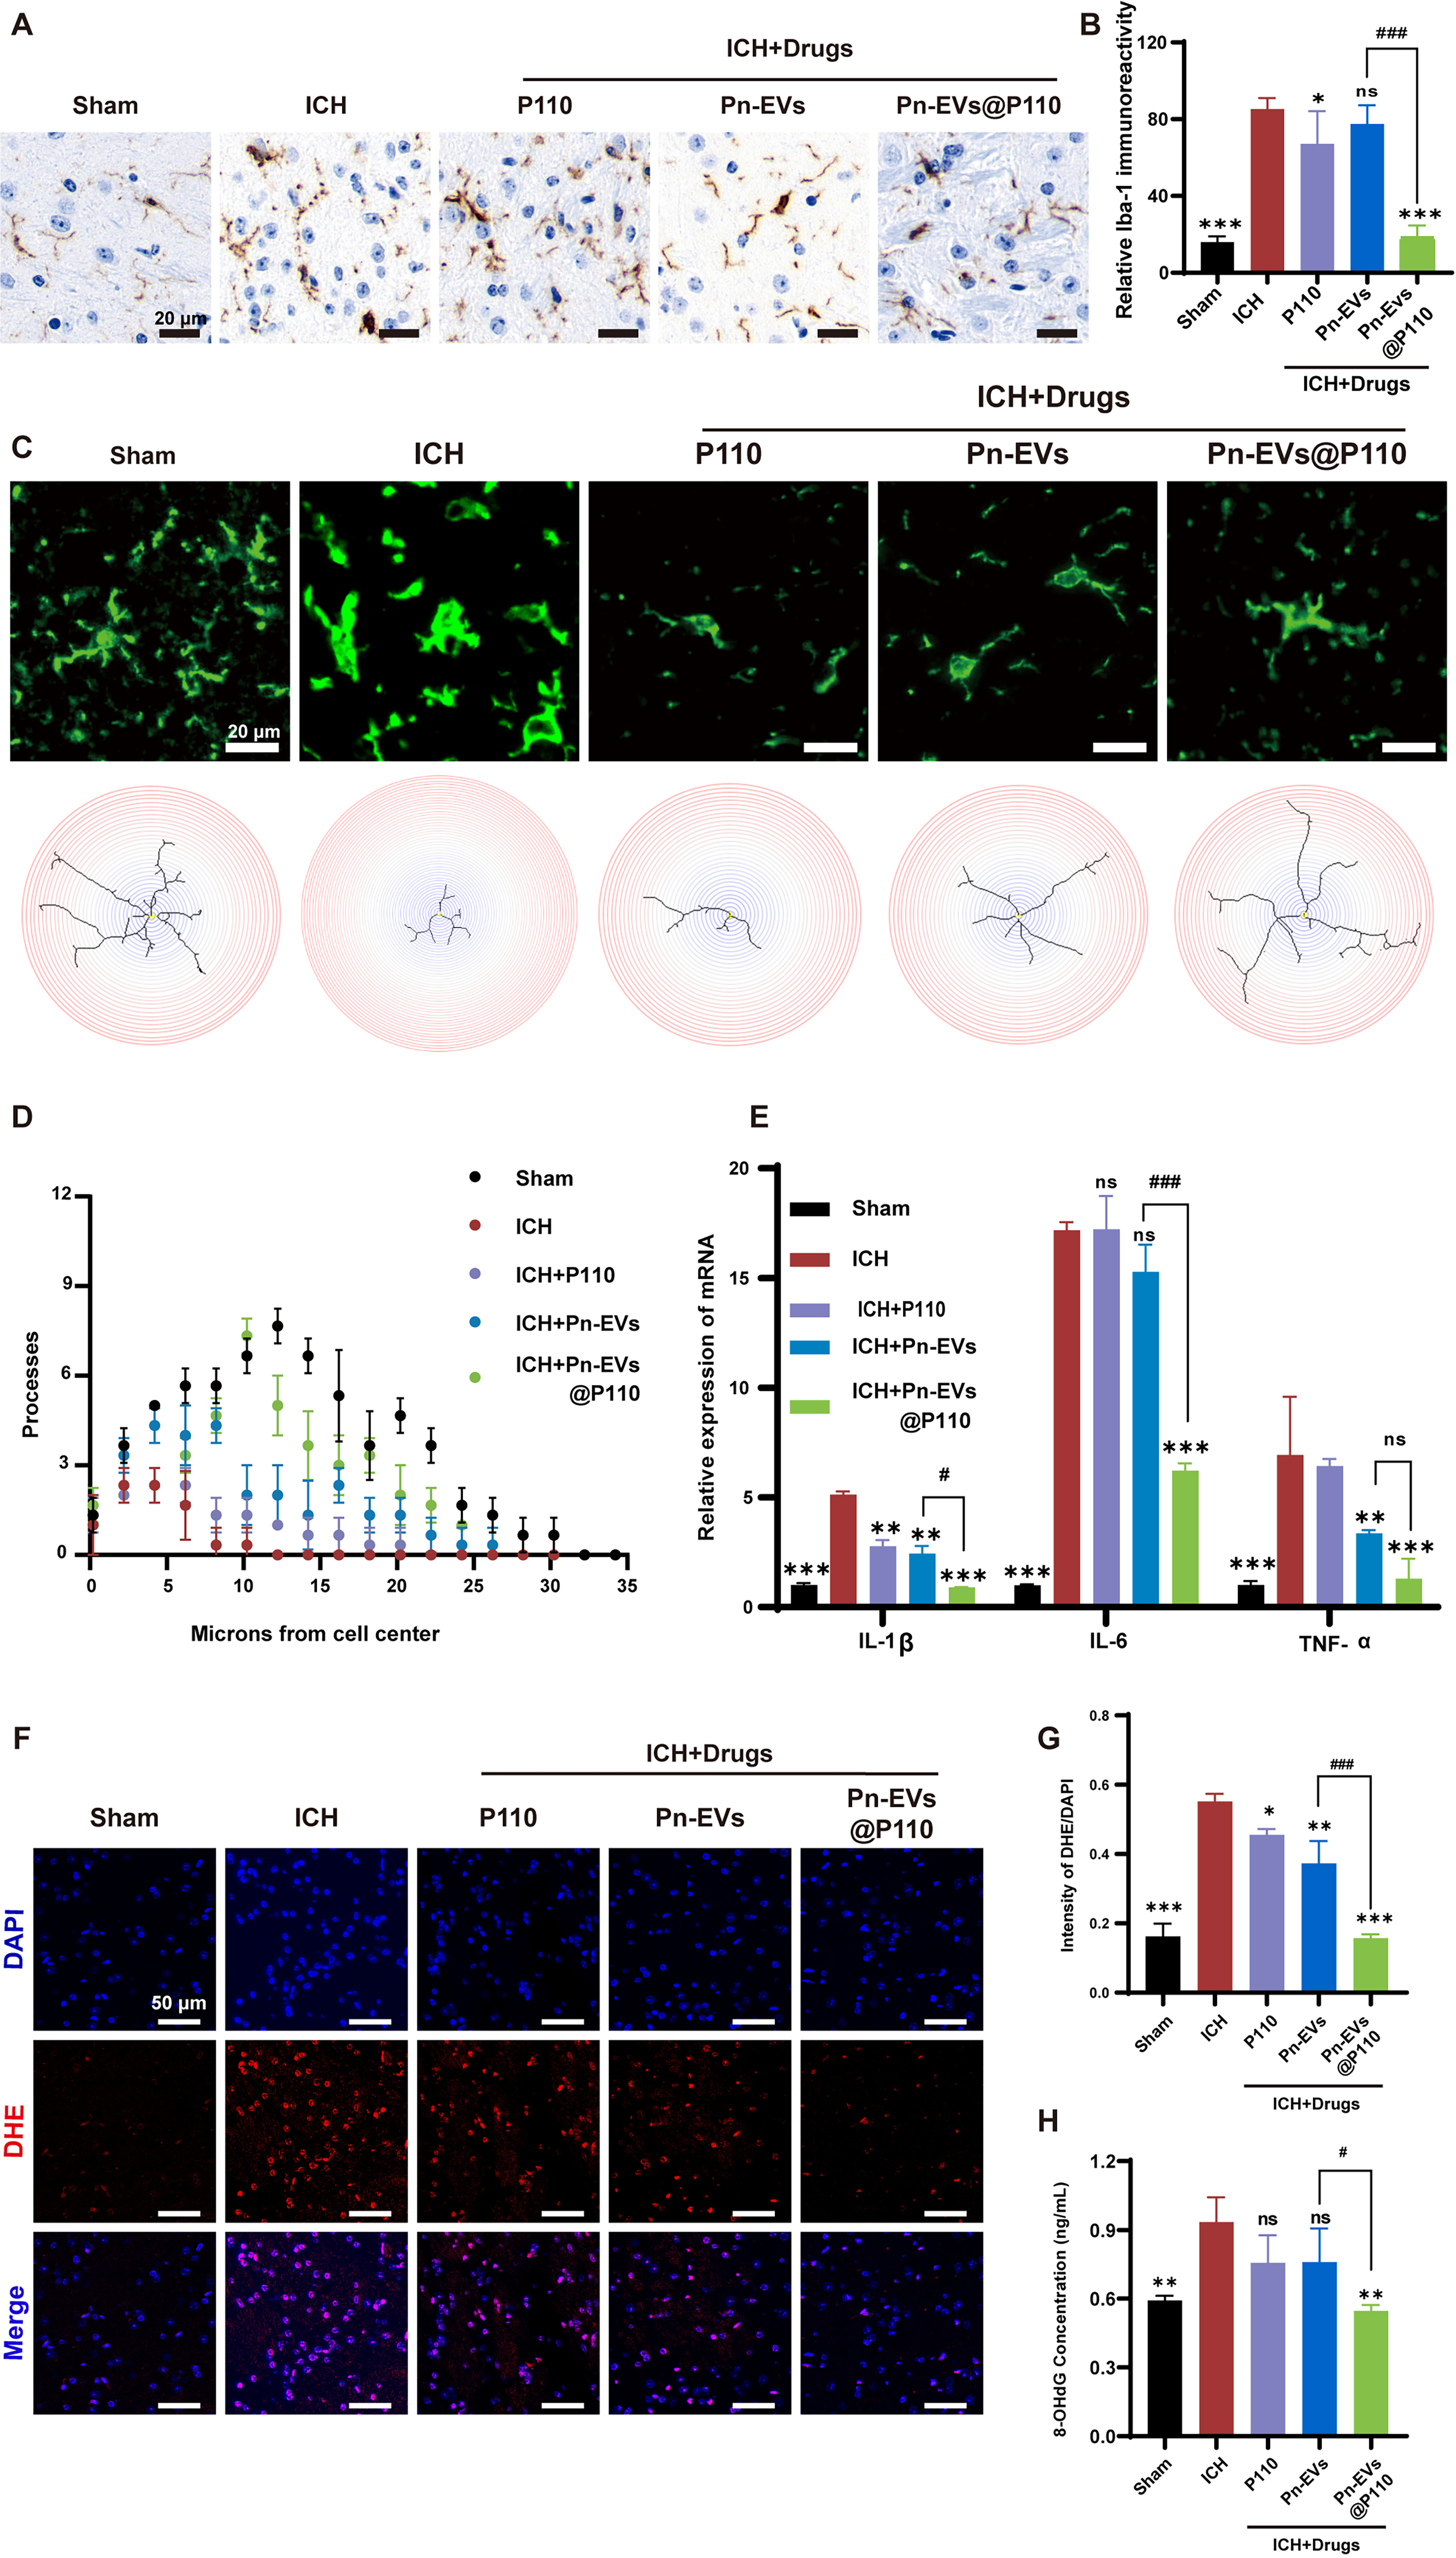
Figure 5. Pn-EVs@P110 suppresses microglial activation, neuroinflammation, and oxidative stress (in vivo). (A) Representative Iba-1 immunohistochemistry images in perihematomal regions; (B) Quantification of relative Iba-1 immunoreactivity; (C) Representative immunofluorescence images of activated microglia (Iba-1, green) and corresponding Sholl reconstruction maps; (D) Sholl analysis quantifying microglial process complexity; (E) qRT-PCR analysis of pro-inflammatory cytokine mRNA levels (IL-1β, IL-6, TNF-α) in perihematomal tissue; (F) Representative DHE staining images (red) with DAPI (blue); (G) Quantification of DHE fluorescence intensity; (H) 8-OHdG concentration as a marker of oxidative DNA damage. Data are presented as mean ± SD; n = 3 mice/group. *P < 0.05, **P < 0.01, ***P < 0.001 vs. ICH; #P < 0.05, ##P < 0.01, ###P < 0.001 vs. Pn-EVs or P110, as indicated by the brackets. Iba-1: Ionized calcium-binding adapter molecule 1; qRT-PCR: quantitative real-time polymerase chain reaction; mRNA: messenger RNA; IL-1β: interleukin-1β; IL-6: interleukin-6; TNF-α: tumor necrosis factor-α; DHE: dihydroethidium; DAPI: 4’,6-diamidino-2-phenylindole; 8-OHdG: 8-hydroxy-2’-deoxyguanosine; Pn-EVs: Panax notoginseng-derived extracellular vesicle-like nanovesicles; ICH: intracerebral hemorrhage; SD: standard deviation; ns: not significant.




