





fig4
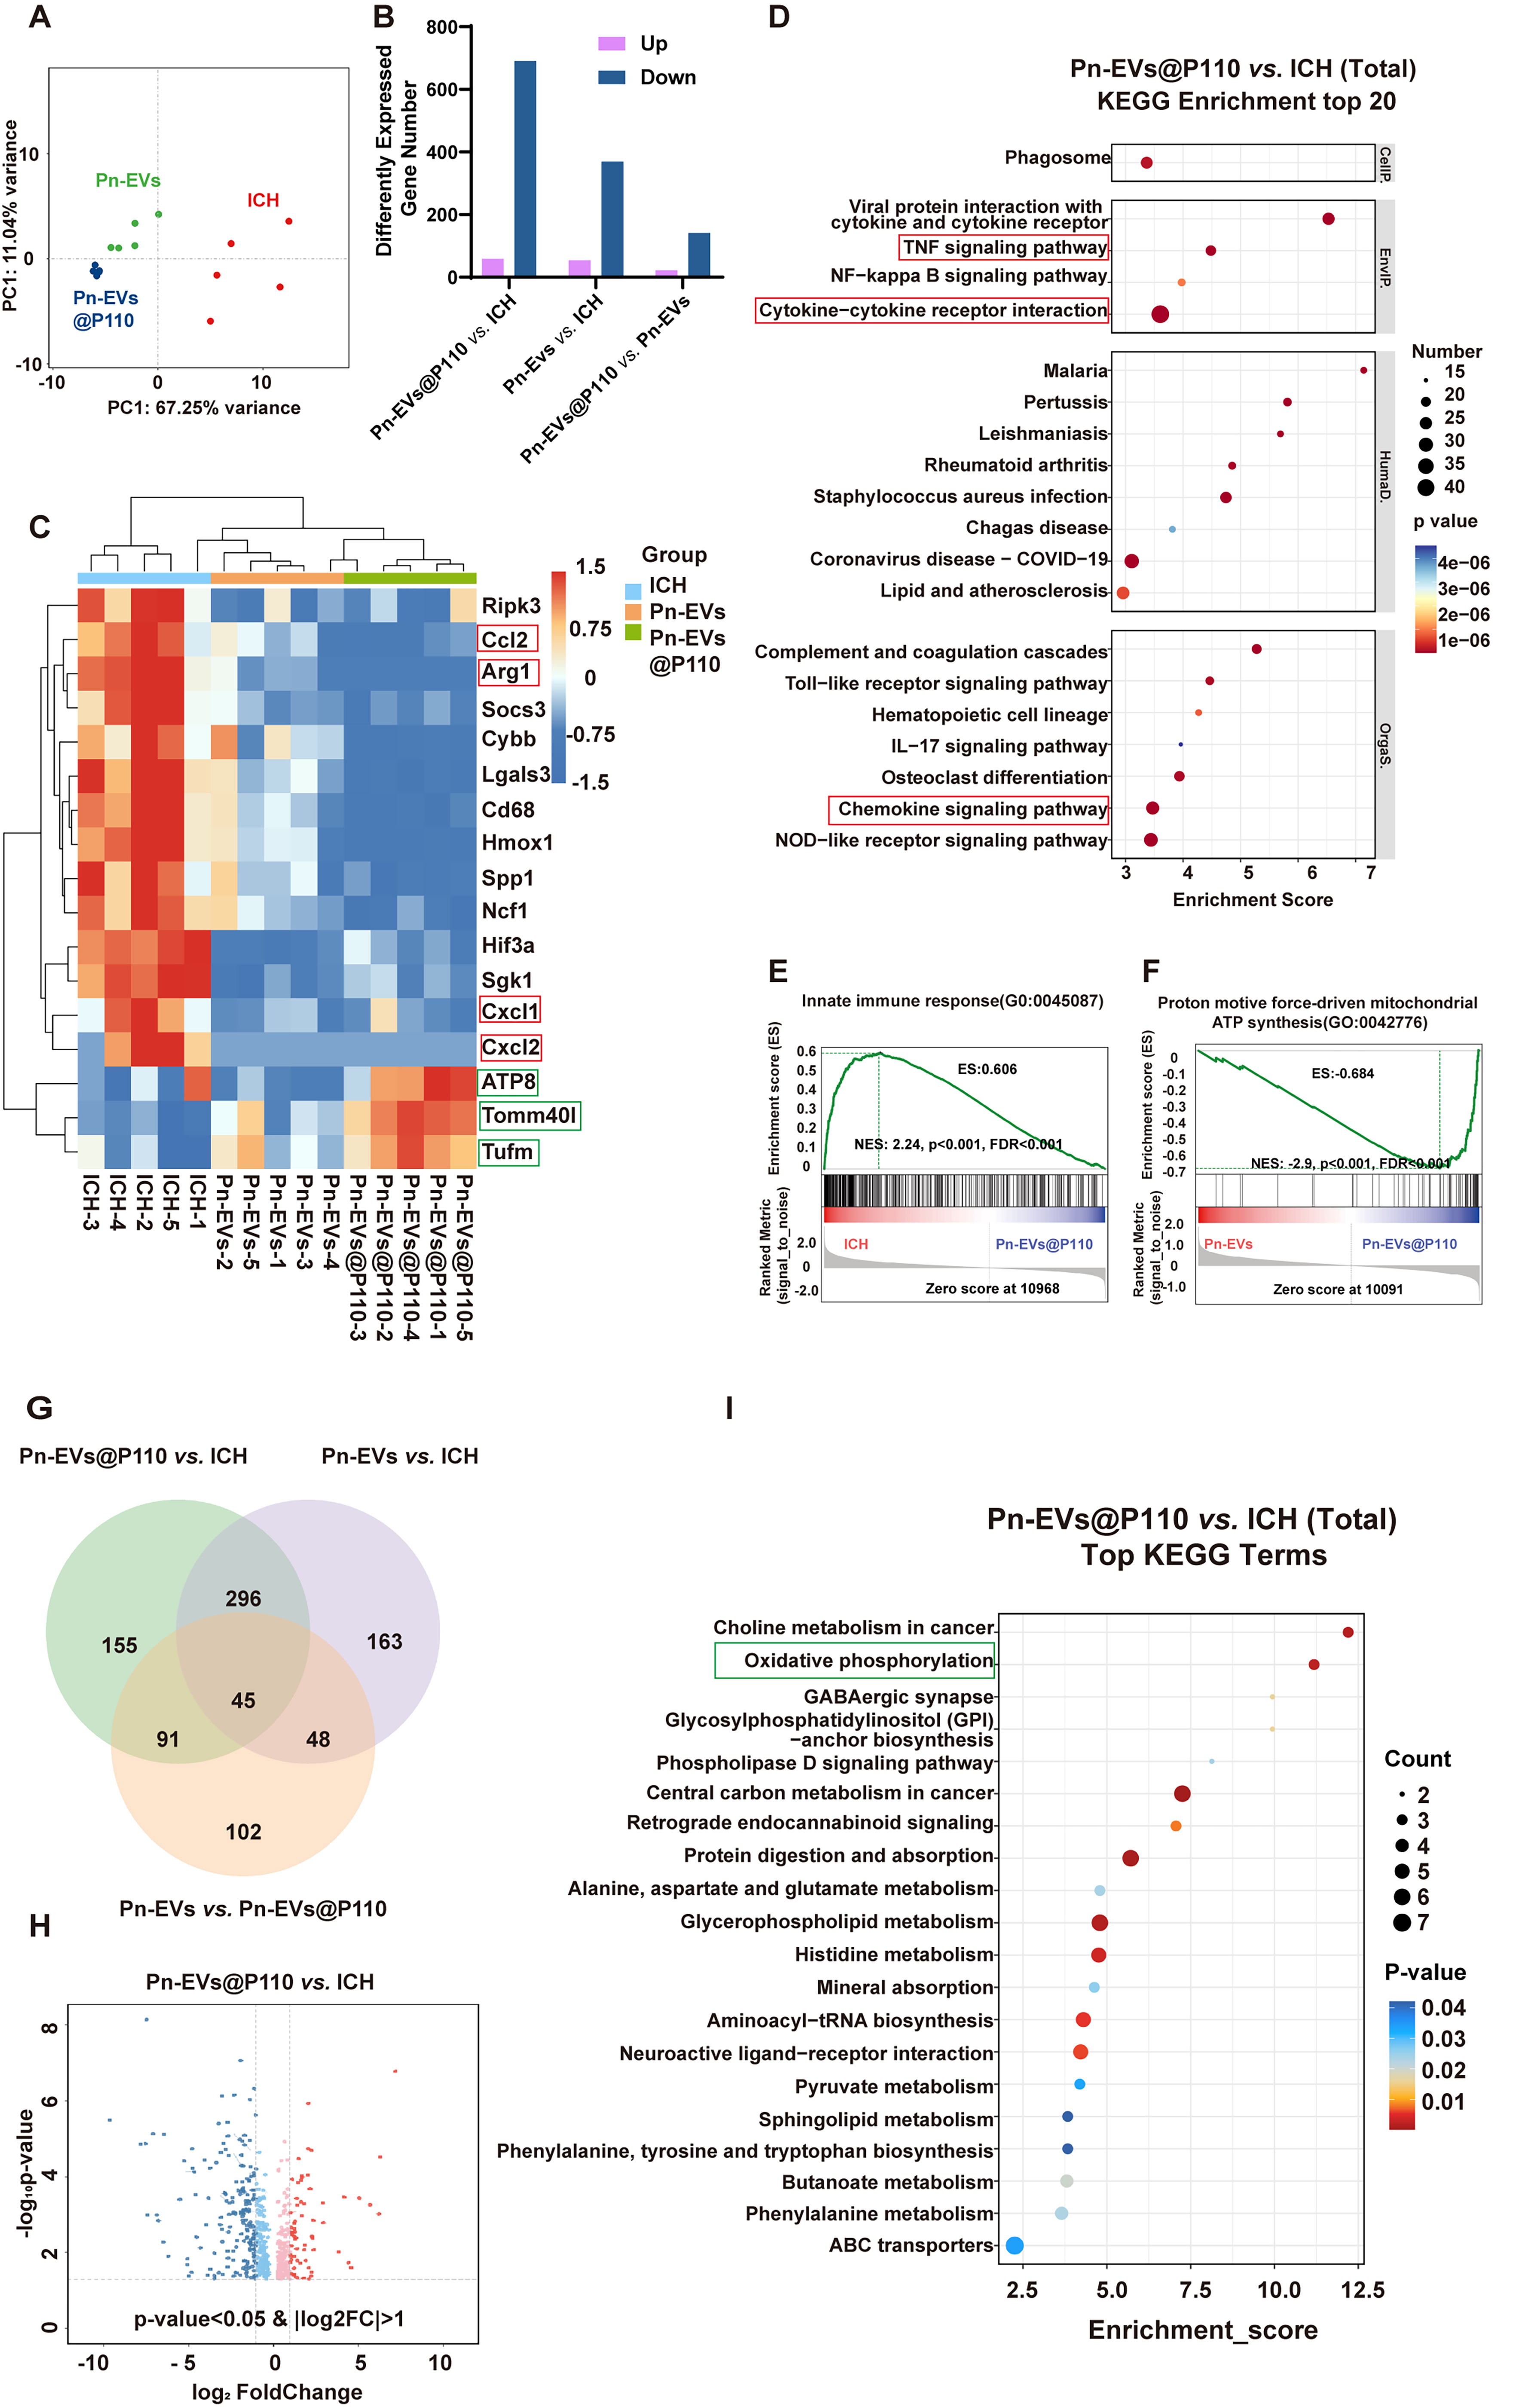
Figure 4. Transcriptomic and metabolomic analyses reveal suppression of inflammatory signaling and modulation of mitochondrial-related pathways after Pn-EVs@P110 treatment (in vivo, perihematomal tissue). (A) PCA score plot showing global transcriptional differences among groups; (B) Number of DEGs in pairwise comparisons; (C) Heatmap of representative inflammation-related and mitochondria-associated genes across groups; (D) KEGG enrichment analysis of total DEGs in Pn-EVs@P110 vs. ICH (top 20 terms); (E and F) GSEA showing representative enrichment of innate immune response and mitochondrial ATP synthesis-related gene sets; (G) Venn diagram showing overlap of differential metabolites among comparisons; (H) Volcano plot of differential metabolites (P < 0.05 and |log2 fold change |> 1, as indicated); (I) Top KEGG terms enriched in Pn-EVs@P110 vs. ICH. n = 4 independent biological samples/group. PCA: Principal component analysis; DEGs: differentially expressed genes; KEGG: Kyoto Encyclopedia of Genes and Genomes; GSEA: gene set enrichment analysis; ATP: adenosine triphosphate; Pn-EVs: Panax notoginseng-derived extracellular vesicle-like nanovesicles; ICH: intracerebral hemorrhage.




