





fig1
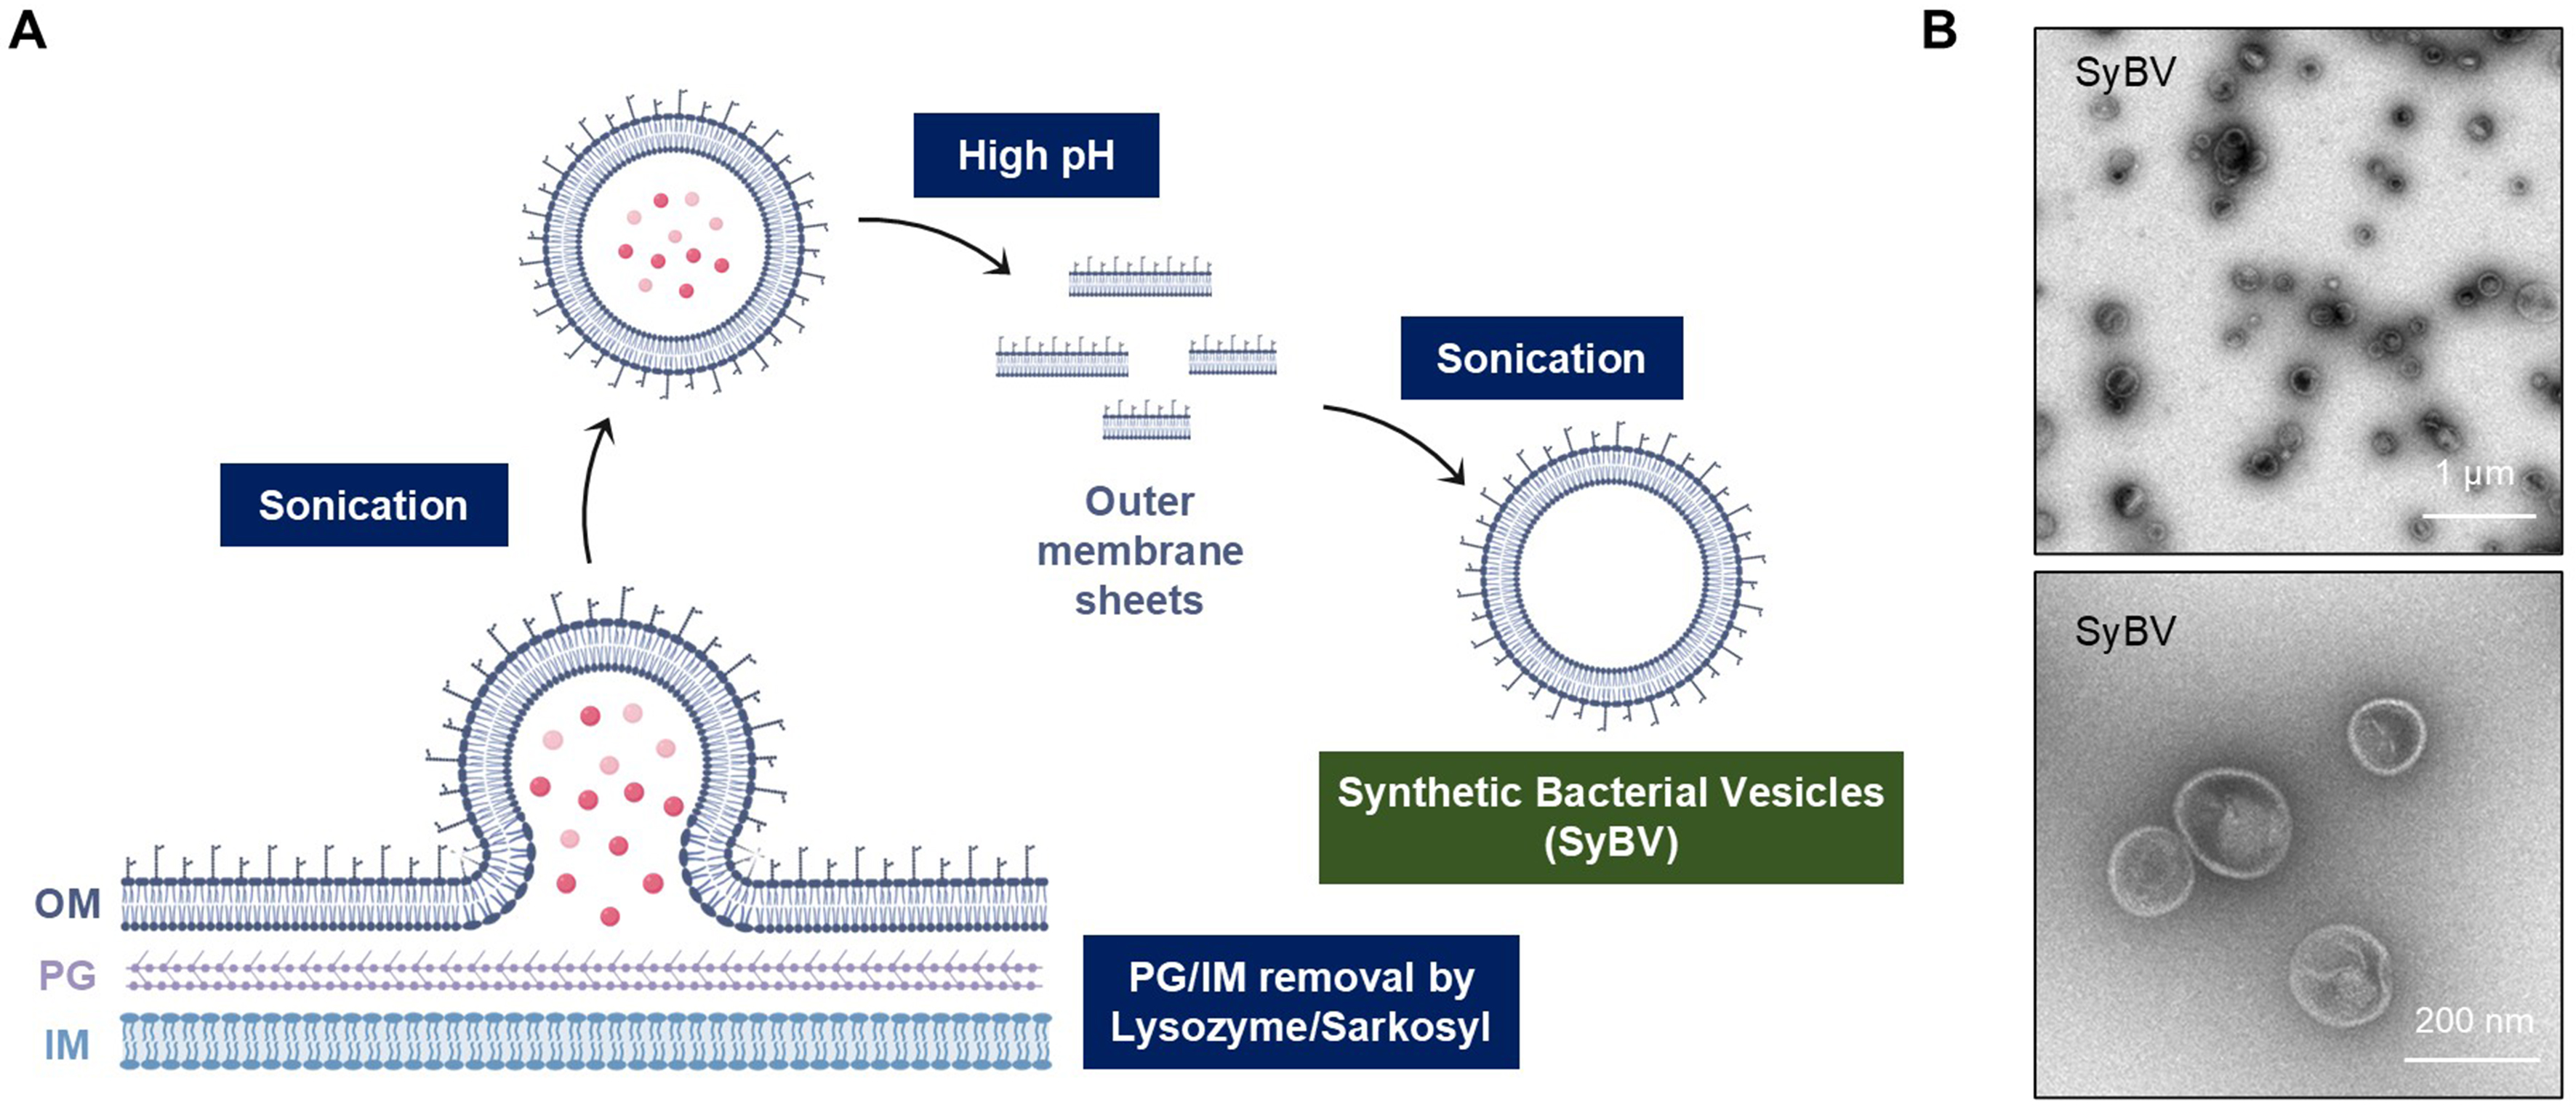
Figure 1. Schematic diagram for SyBV isolation from bacterial membranes. (A) OM sheets were separated from the PG layer and IM through sequential chemical treatments, followed by sonication and high pH treatment (200 mM Na2CO3, pH 11). The resulting membrane sheets were re-vesiculated into SyBV by mild sonication; (B) TEM images showing the morphology of the isolated SyBV. Scale bars, 1 µm (upper image) and 200 nm (lower image). Created with BioRender.com (2026). SyBV: Synthetic bacterial vesicle; OM: outer membrane; PG: peptidoglycan; IM: inner membrane; TEM: transmission electron microscopy.




