





fig4
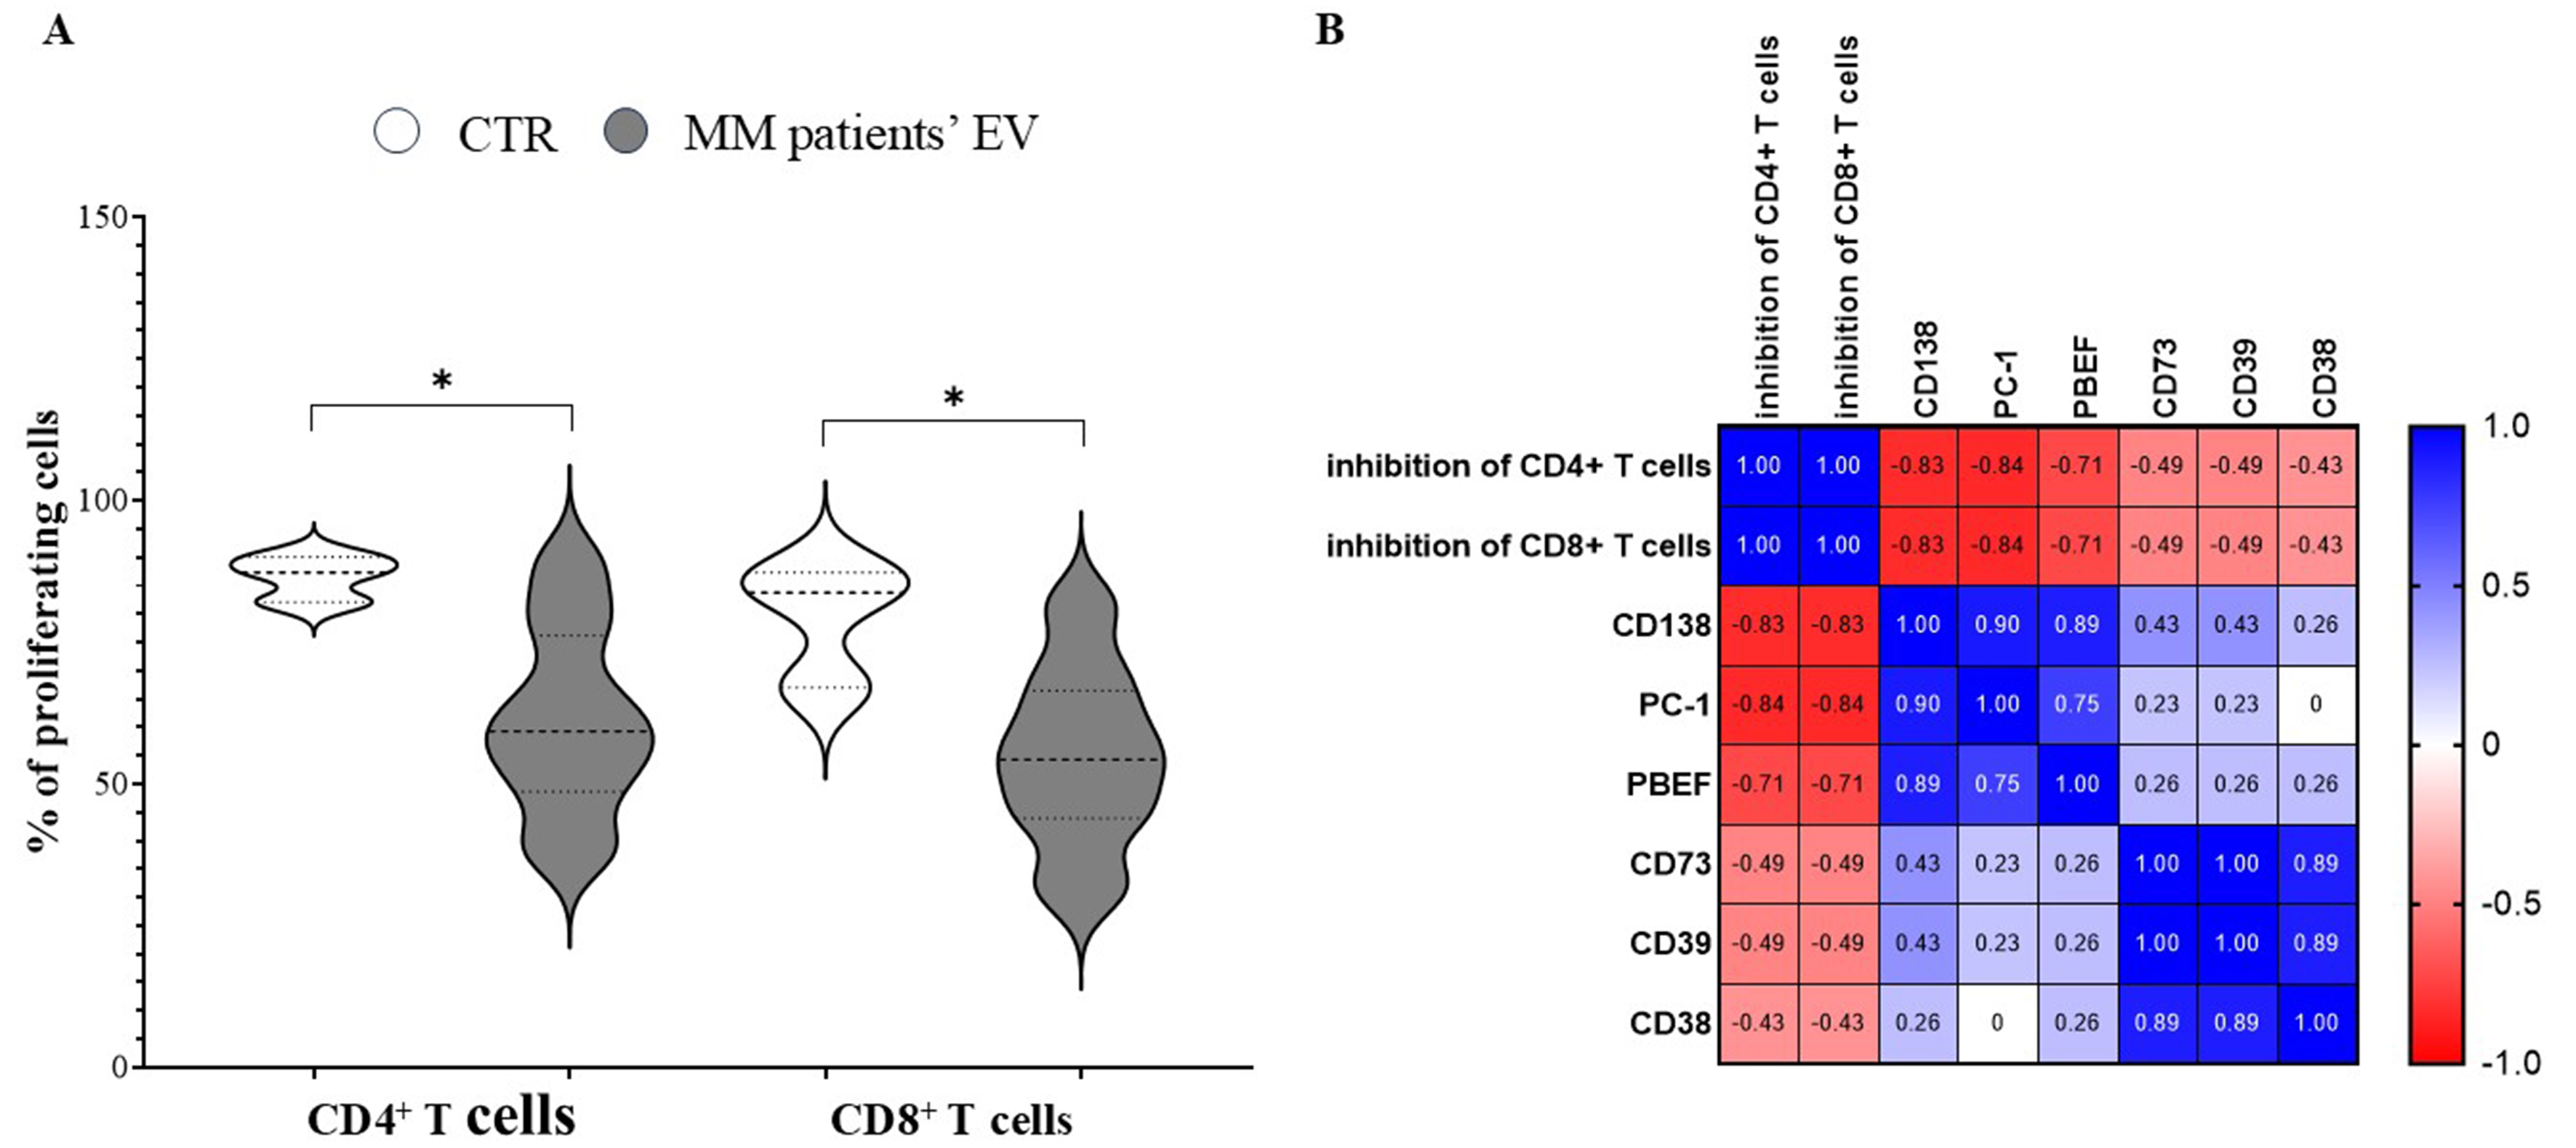
Figure 4. Immune-regulatory properties of MM-derived EVs. (A) Violin plots indicate the percentage of CD4+ and CD8+ T cells that proliferated after SEB stimulation, in the presence (grey profiles) or absence (white profiles) of MM-derived EVs. Profile spikes indicate maximum and minimum values, whereas dotted horizontal lines indicate quartiles and medians. Statistically significant differences were calculated using the Mann-Whitney test (*P ≤ 0.05) and are indicated by an asterisk. Correlations between different parameters, calculated by linear regression, are shown in the correlogram in (B) including (i) inhibition of CD4+ or CD8+ T cell proliferation and (ii) expression of different molecules on EVs. Blue indicates positive correlations (between 0 and 1), whereas red indicates inverse correlations (between 0 and -1). CTR: Control; MM: multiple myeloma; EVs: extracellular vesicles; SEB: staphylococcal enterotoxin B; PBEF: pre-B-cell colony-enhancing factor; PC-1: plasma cell antigen-1 (ectonucleotide pyrophosphatase/phosphodiesterase 1, ENPP1); CD: cluster of differentiation.




