


fig4
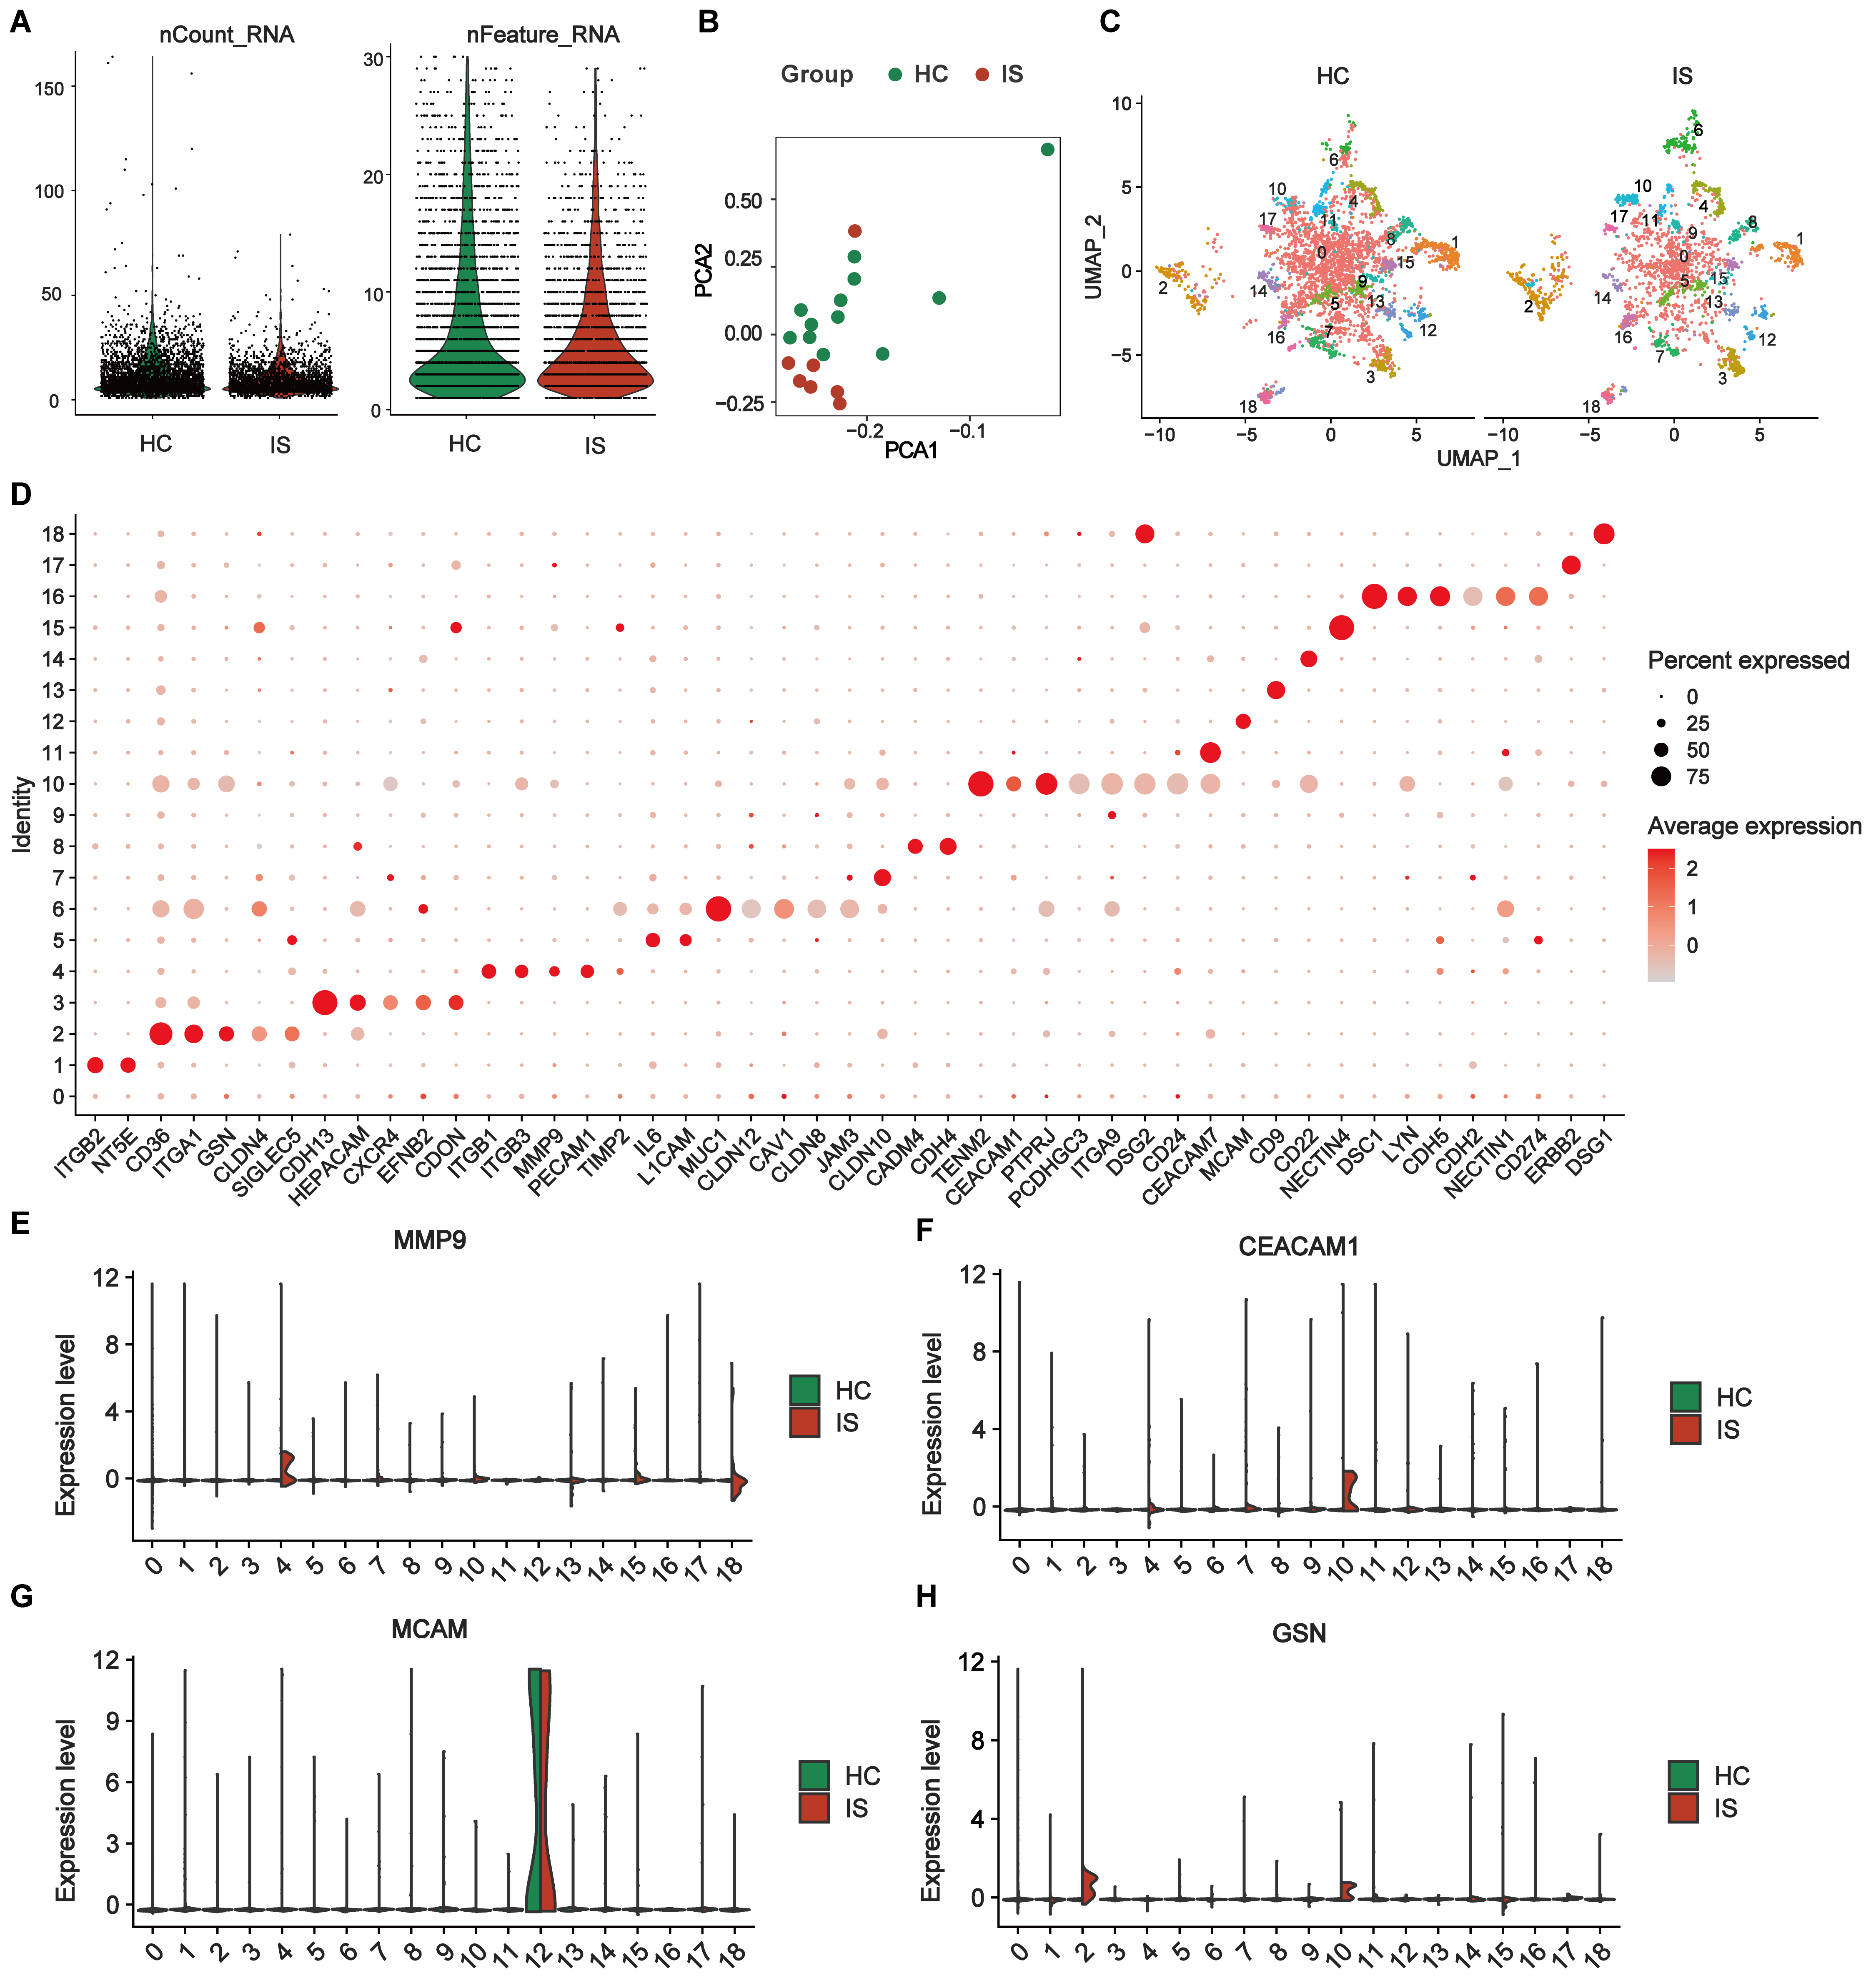
Figure 4. Differential expression profiles of single-EV surface proteins in the exploration subset. (A) Quality-control metrics of single-EV PBA data showing the distributions of nCount_RNA and nFeature_RNA after stringent EV-level filtering (Filter 2.2; EVs retained only if ≥ 2 proteins had detected expression ≥ 2) comparing HCs and IS; (B) PCA of SCTransform-normalized, Harmony-integrated EV surface protein profiles; (C) UMAP visualization of the integrated dataset shown separately for HCs and IS, revealing 19 EV subpopulations (Seurat clusters 0-18); (D) Dot plot of representative cluster-enriched marker proteins identified by Seurat FindMarkers (Wilcoxon rank-sum test; avg log2-fold change ≥ 0.25; Benjamini-Hochberg adjusted P < 0.05). For each cluster, up to six top-ranked markers are shown (all markers are displayed when a cluster contains ≤ 6 significant markers). Dot size indicates the percentage of EVs expressing the marker within each cluster; dot color indicates average normalized expression; (E-H) Ridge plots showing the distribution of normalized expression levels for key marker proteins (MMP9, CEACAM1, MCAM, and GSN) across EV clusters 0-18, split by group (HCs vs. IS). Exploration subset: IS (n = 7) and HCs (n = 12). IS: Ischemic stroke; HCs: healthy controls; EVs: extracellular vesicles; PBA: proximity barcoding assay; PCA: principal component analysis; MMP9: matrix metalloproteinase 9; CEACAM1: carcinoembryonic antigen-related cell adhesion molecule 1; MCAM: melanoma cell adhesion molecule; GSN: gelsolin.


