

fig8
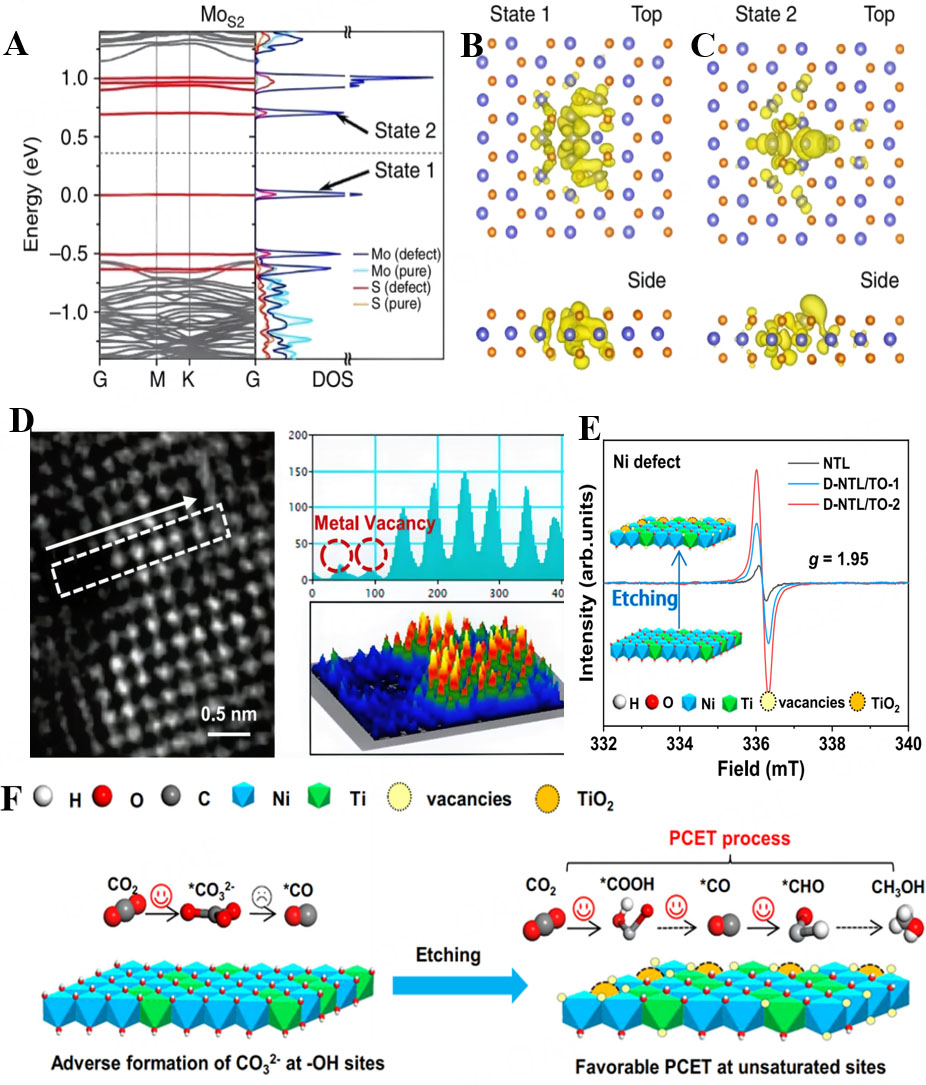
Figure 8. Evidence for vacancy defects in modulating electronic structure and CO2 reduction pathways: (A) Band structure and corresponding density of states (DOS) of antisite defect MoS2. The grey bands are from normal lattice sites, similar to conduction band and valence band of perfect monolayer, while the discrete red bands show the localized defects states. The DOS is projected onto the atoms around the defect (defect) and those in the middle plane of two adjacent defects (pure), respectively. The grey dashed line indicates the position of the Fermi Level. (B, C) Real-space distribution of the wave functions of the two defect states below and above the Fermi energy. Figure 8A-C is reprinted from Ref.[113] under the CC BY 4.0 license; (D)AC-TEM image with corresponding 3D surface plot and atomic profile of white-dotted area, and m EDS-STEM element mapping of D-NTL/TO-2. (E)EPR spectra of bulk NTL and acid-etched derivatives. (F) Schematic illustration of the CO2 activation mechanism on NTL and D-NTL/TO. Figure 8D-F is reprinted from Ref.[115] under the CC BY-NC-ND license. D-NTL/TO: Defective NiTi-layered double hydroxide/titanium dioxide; PCET: proton-coupled electron transfer; AC-TEM: Aberration-corrected transmission electron microscopy; EDS-STEM: energy-dispersive X-ray spectroscopy–scanning transmission electron microscopy; EPR: electron paramagnetic resonance.

