



fig4
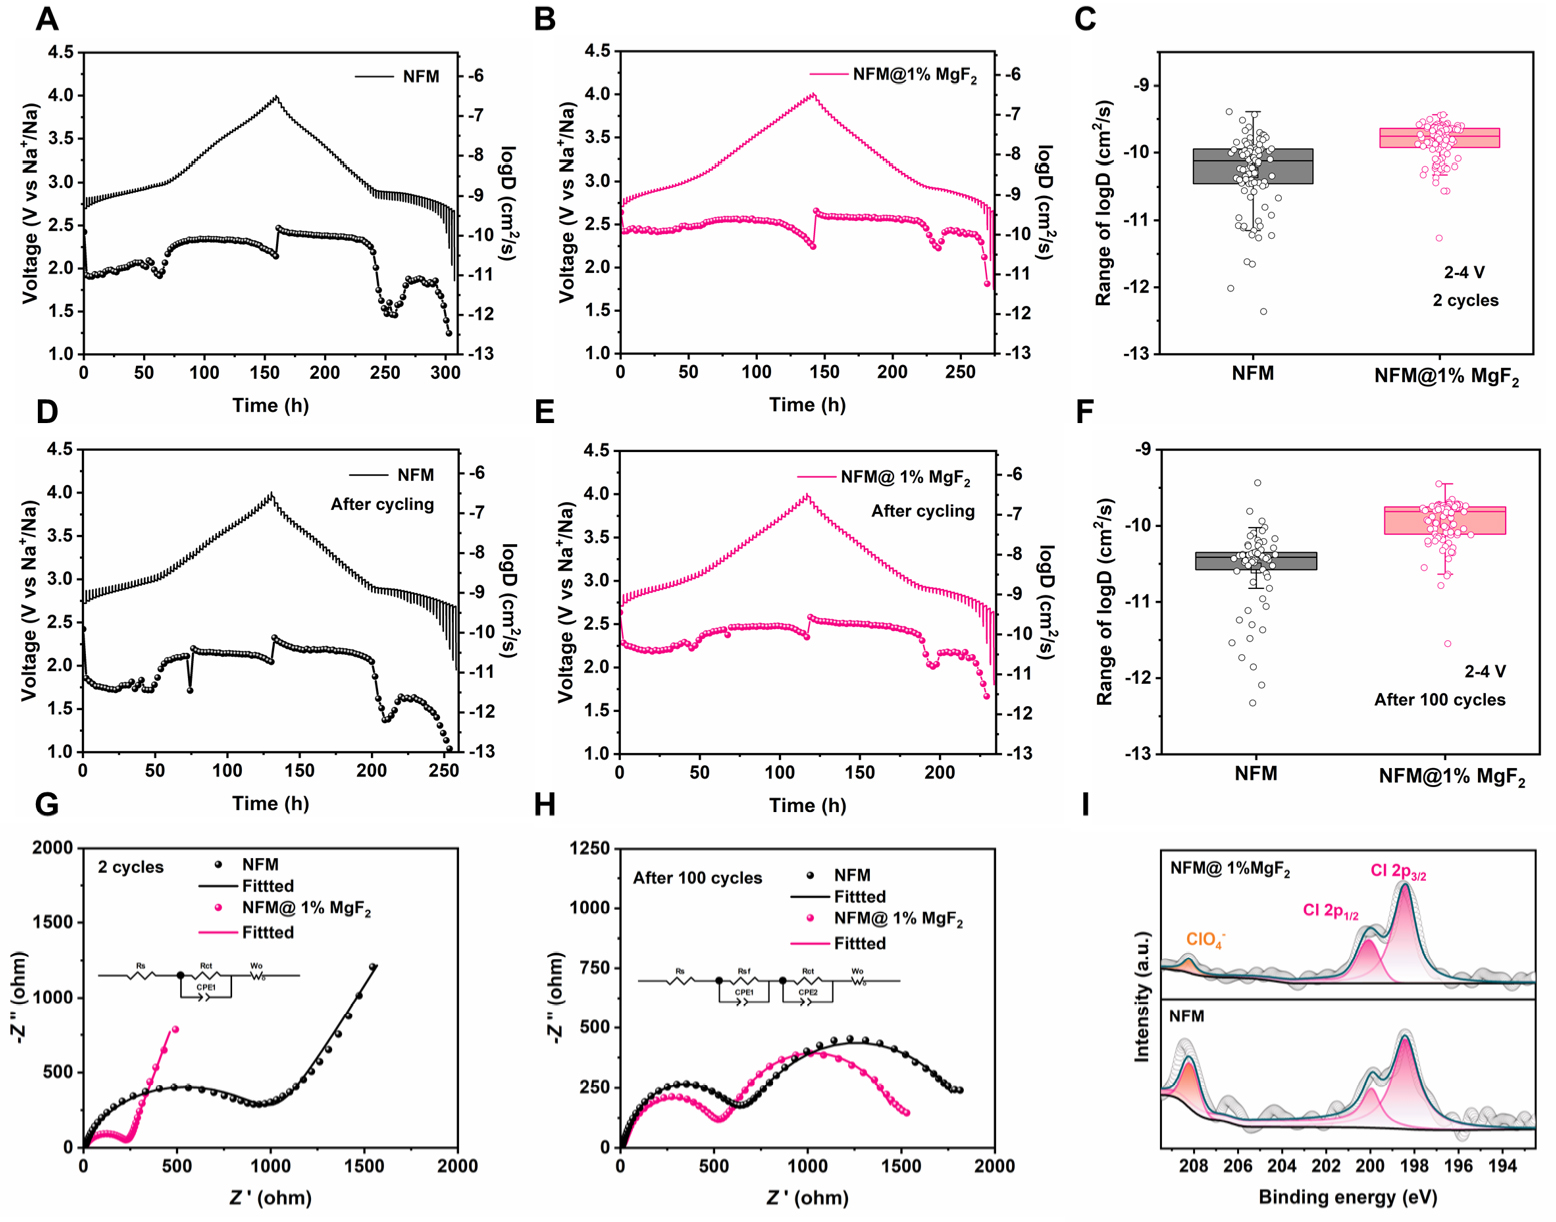
Figure 4. Electrochemical characterization and interfacial evolution of pristine NFM and NFM@1%MgF2. (A and B) Representative GITT and calculated Na+ diffusion coefficients of pristine NFM and NFM@1%MgF2 after 2 cycles. (C, F) Box plots of the logD values calculated from the corresponding GITT steps in (A and B) and (D and E), respectively. The scattered points represent individual logD values obtained from valid GITT steps within the corresponding representative GITT measurement, rather than from independent repeated experiments. The boxes indicate the 25-75th percentile range, the horizontal lines indicate the median values, the square symbols indicate the mean values, and the whiskers indicate the minimum-maximum range. The sample size n represents the number of valid GITT-derived logD values used for each box plot. (D and E) Representative GITT and calculated Na+ diffusion coefficients of pristine NFMand NFM@1%MgF2 after 100 cycles. (G and H) Representative EIS spectrum together with the fitting results of pristine NFM and NFM@1%MgF2 with the inset showing the equivalent circuit for fitting. (I) Cl 2p XPS spectra of cycled pristine NFM and NFM@1%MgF2 after 100 cycles.





