



fig3
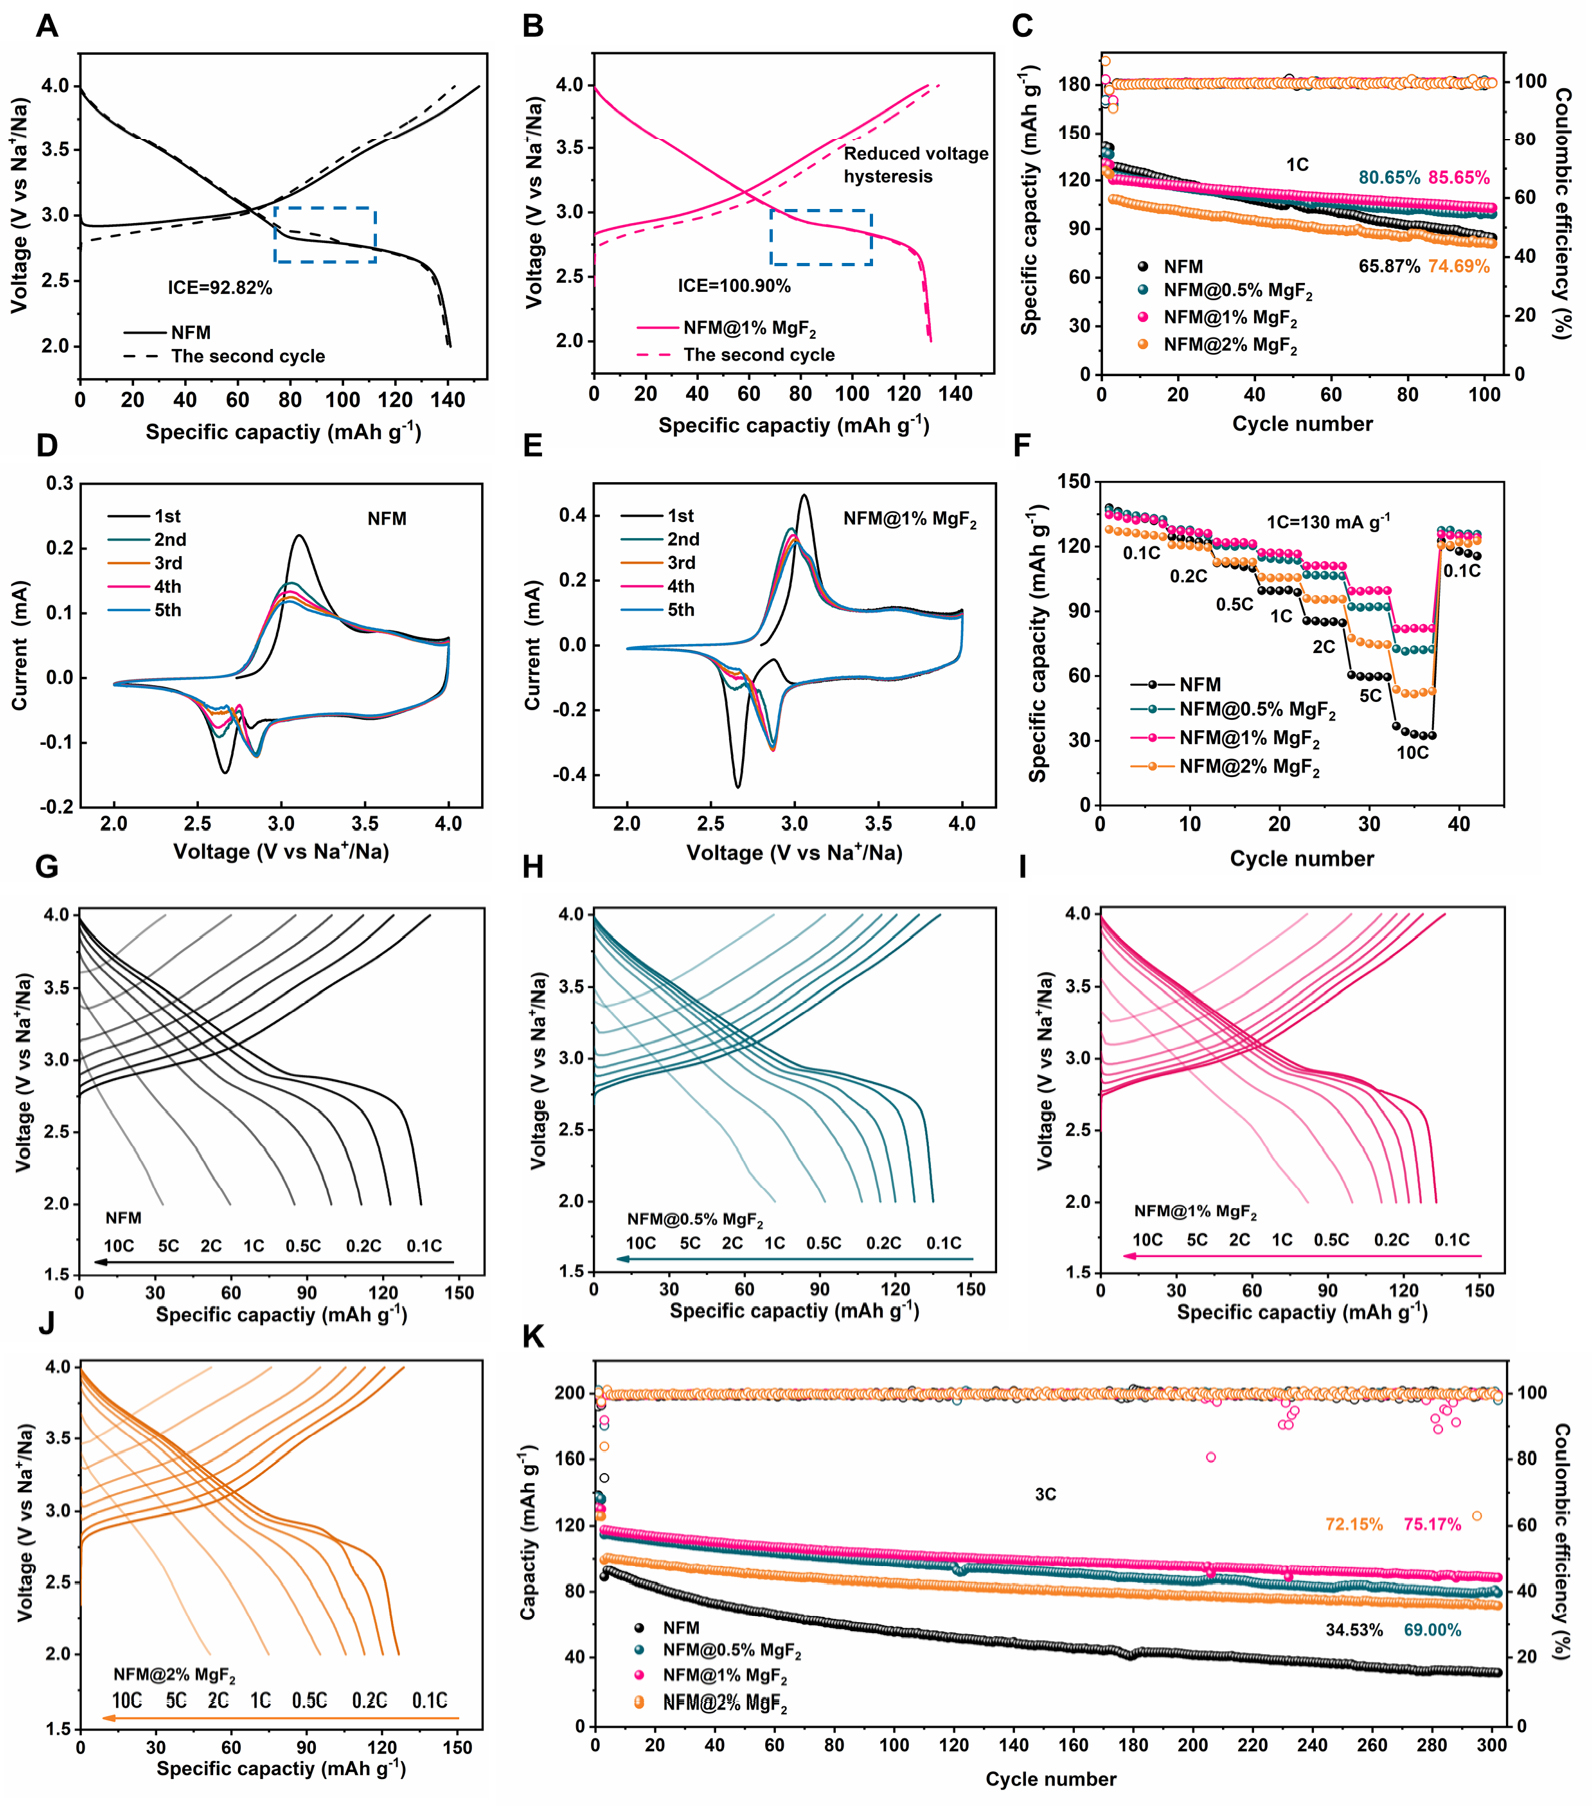
Figure 3. Electrochemical behaviors of pristine NFM and MgF2-loaded NFM electrodes measured between 2.0 and 4.0 V. (A and B) GCD profiles of pristine NFM and NFM@1%MgF2 of the initial two cycles of 0.1C, the second cycle is dashed line. The blue dashed lines indicate the alleviated voltage hysteresis. (C) Cycling performance of 1C. (D and E) CV curves of pristine NFM and NFM@1%MgF2 recorded during the 5 cycles at a scanning speed at 0.1 mV s-1. (F) Rate capability from 0.1C to 10C. (G-J) GCD curves collected at 0.1-10C for the rate-performance test. (K) Long-cycling performance at 3C.





