


fig9
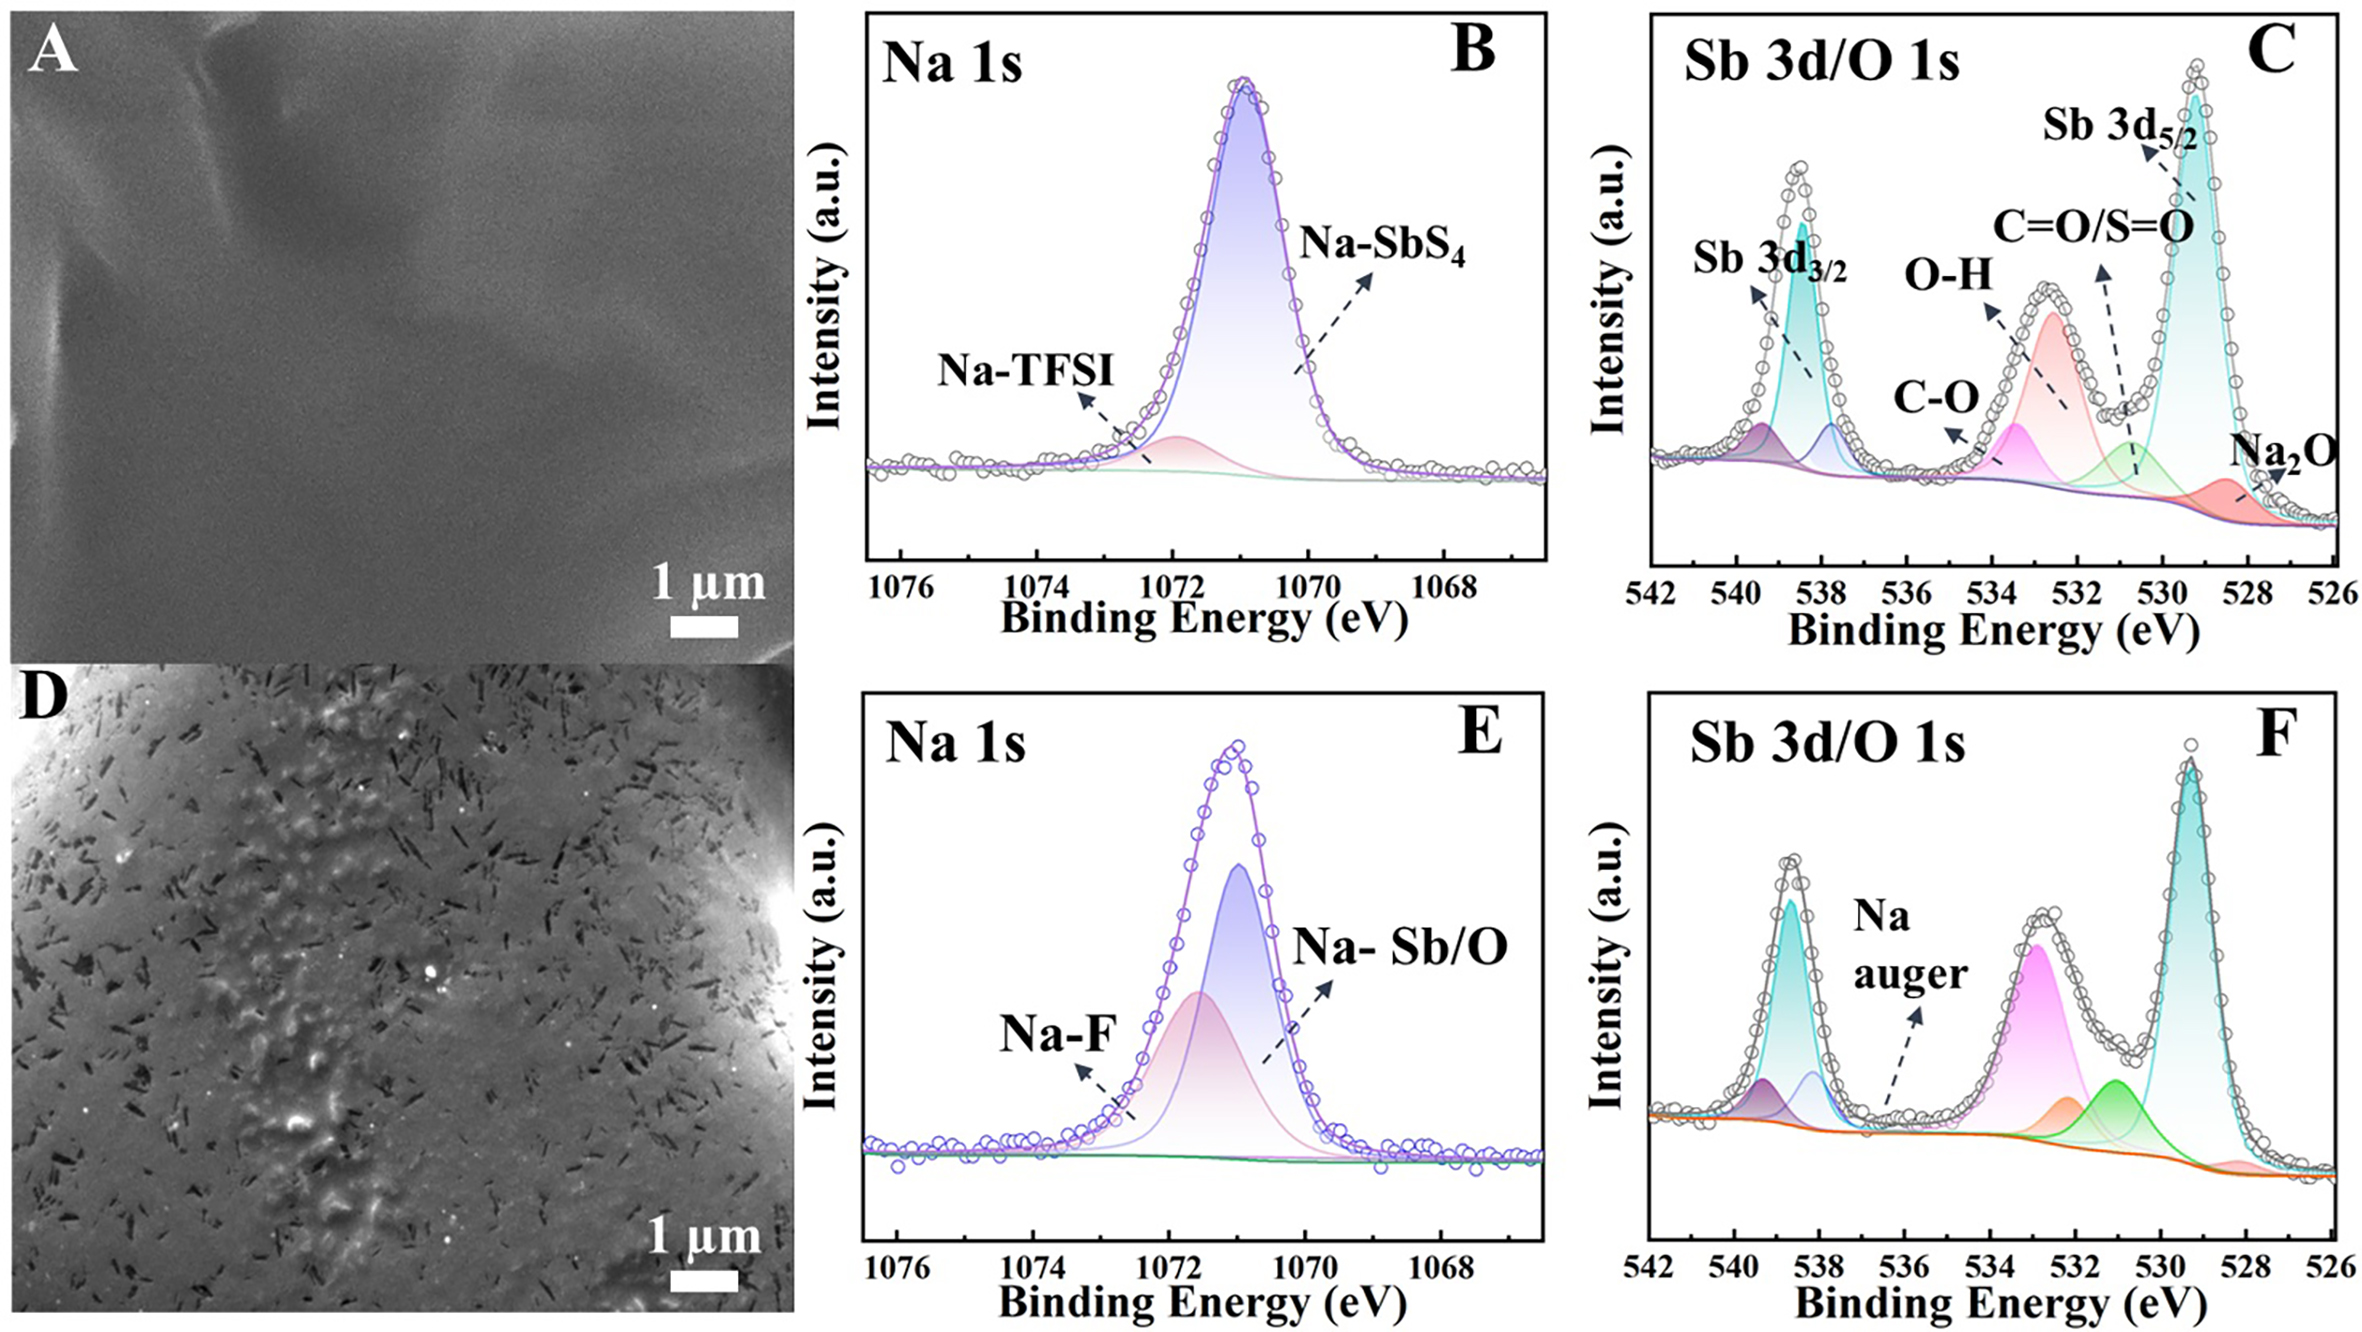
Figure 9. Top-view SEM and XPS analysis of the AAM950-coated NSS solid electrolyte before and after cycling. (A) SEM image of the polymer-coated surface is shown again for better comparison with the pristine NSS in Figure 3A. XPS spectra before cycling include (B) Na 1s and (C) Sb 3d/O 1s. After 50 electrochemical cycles, (D) top-view SEM shows the morphological evolution, while XPS spectra of (E) Na 1s and (F) Sb 3d/O 1s reveal chemical changes at the interface in the disassembled NFMO|7 µL AAM950-NSS-AAM950|Na cell tested at 55 °C.


