


fig11
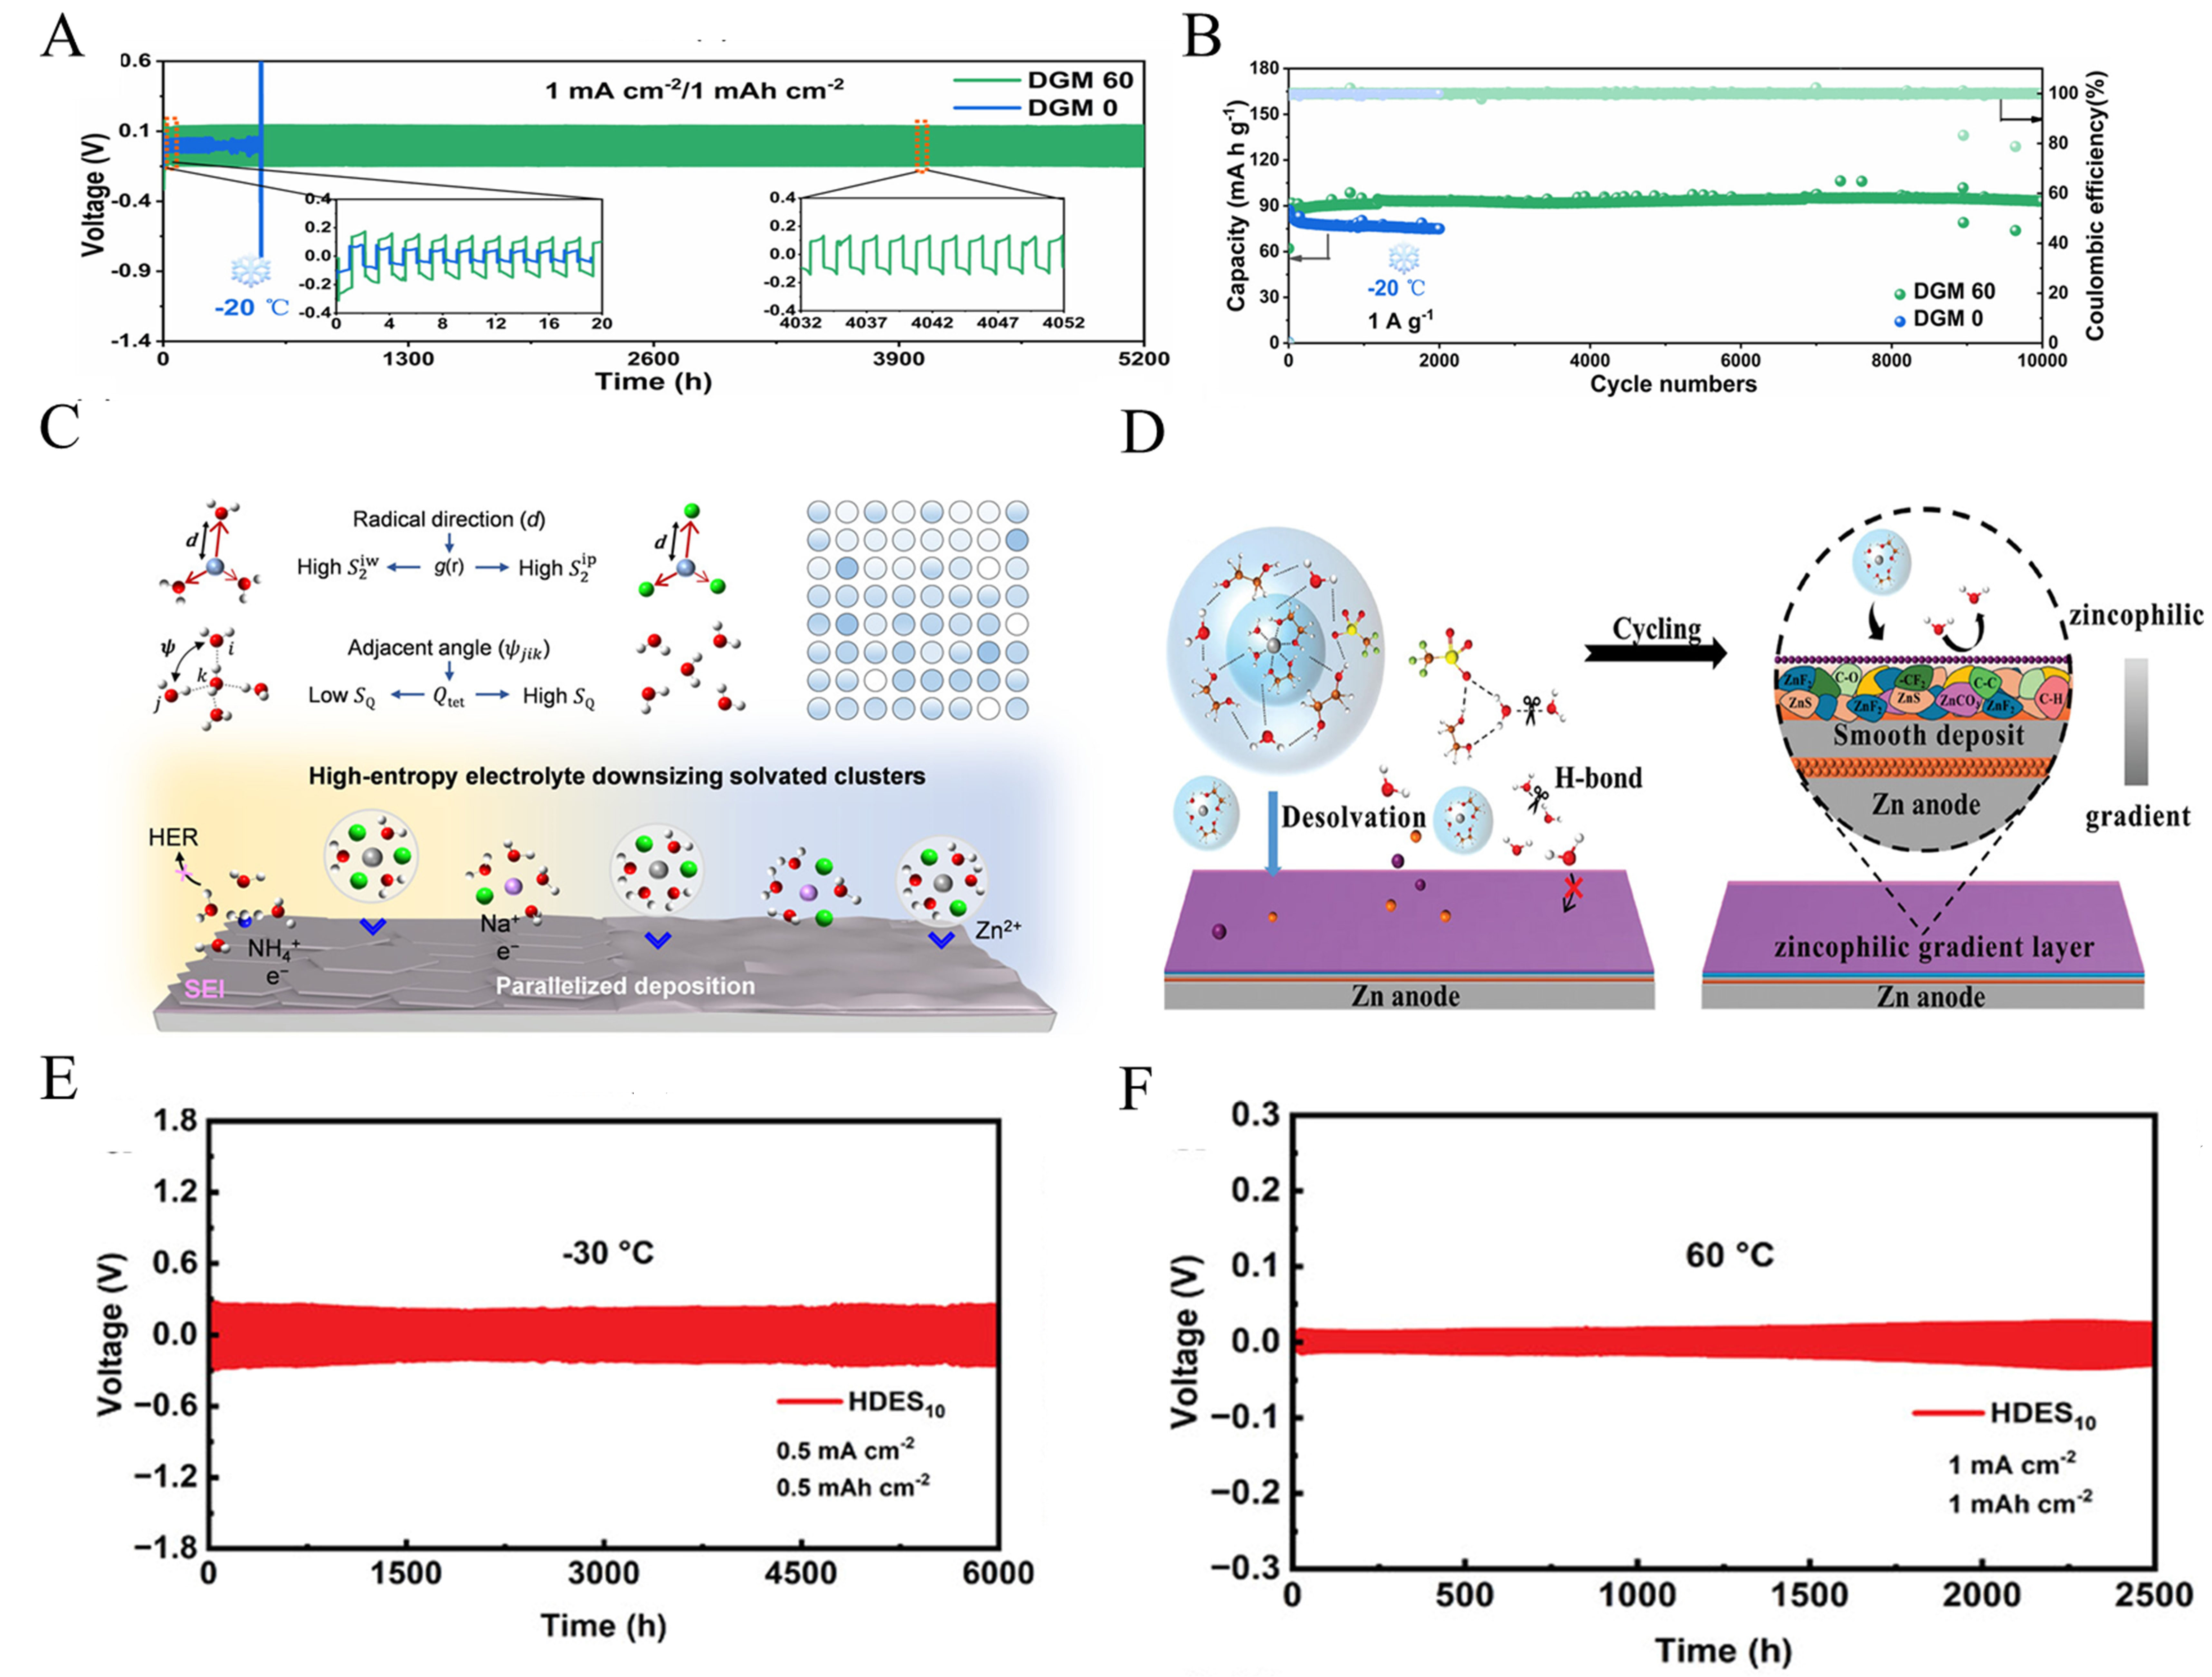
Figure 11. (A) Voltage-time curves of cells at -20 °C. (B) Cycling of Zn||PANI cells under -20 °C at 1A g-1. (A and B) Reprinted with permission from[125]. Copyright 2024, Wiley; (C) Schematic diagrams of integrating entropies in electrolytes. Reprinted with permission from[126]. Copyright 2025, American Chemical Society; (D) Schematic representation of the chemical behavior of the hydrated deep eutectic electrolyte at the bulk phase and interface. (E) Long cycle performance plots of Zn//Zn symmetric cells at -30 °C for HDES10. (F) Long cycle performance plots of Zn//Zn symmetric cells at 60 °C for HDES10. (D-F) Reprinted with permission from[127]. Copyright 2024, Wiley.


