



fig4
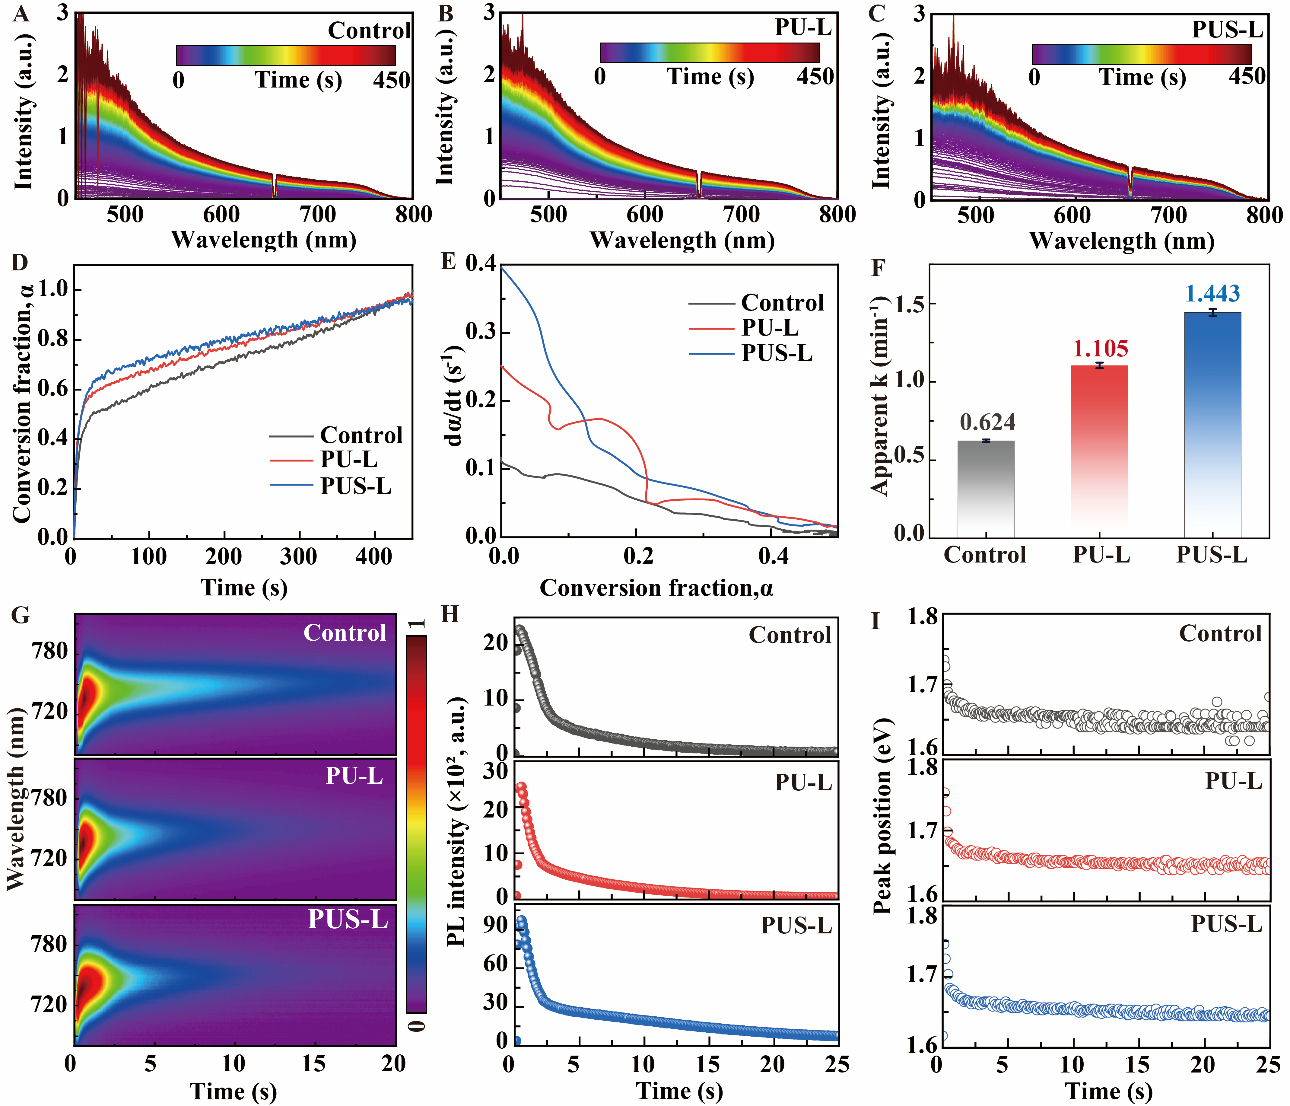
Figure 4. In situ UV-Vis spectra of (A) control, (B) PU-L, and (C) PUS-L recorded during OAS incubation from 0 to 450 s; (D) Conversion fraction α(t) derived from the absorbance at 700 nm over the same incubation period; (E) dα/dt as a function of α; (F) Apparent conversion-rate parameter k obtained by nonlinear least-squares fitting of the individual conversion traces using the Avrami-type expression. Error bars represent the standard errors obtained from nonlinear regression of the individual kinetic traces; (G) In situ PL of the incubation process of Pb(NO3)2 conversion to perovskite; (H) Peak intensity versus time curves, and (I) peak position versus time curves extracted from in situ PL during the perovskite incubation process. PL: Photoluminescence; UV-Vis: ultraviolet-visible spectroscopy; PU-L: sample prepared using a Pb(NO3)2 precursor containing 0.3 mg/mL urea; PUS-L: the corresponding sample after additional heat treatment at 150 °C for 20 min.





