



fig1
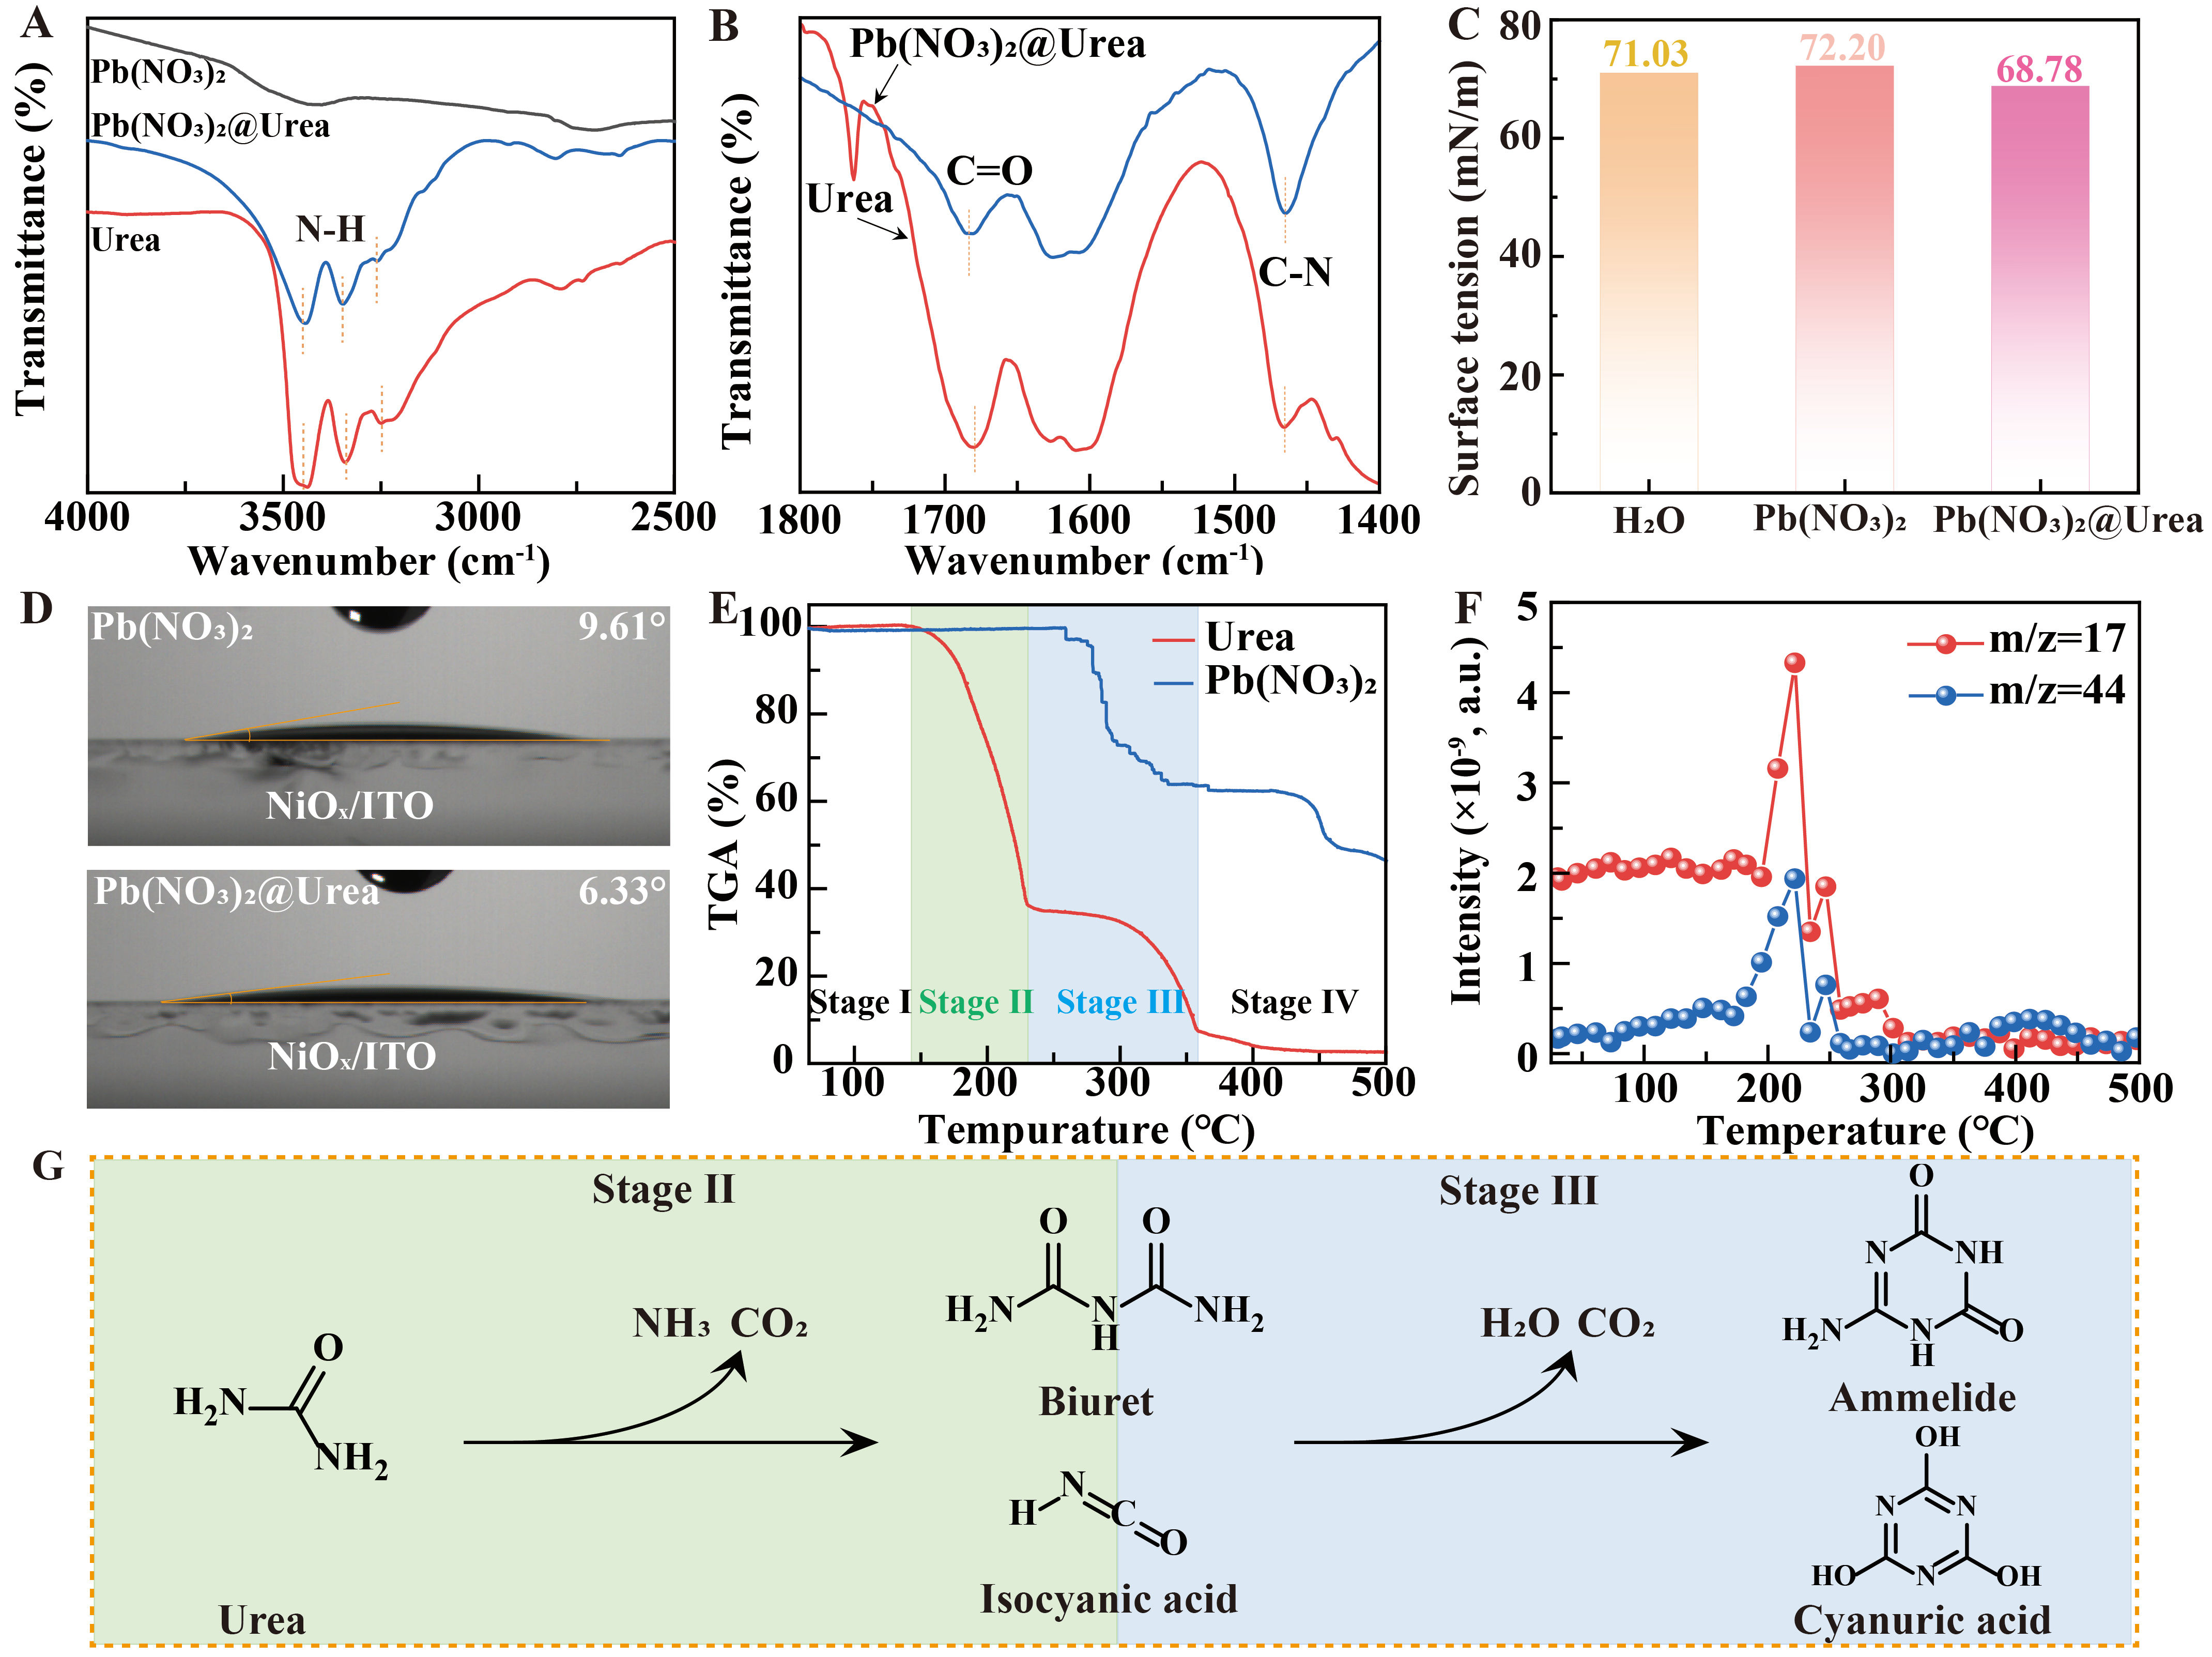
Figure 1. (A) FTIR of Pb(NO3)2, urea and Pb(NO3)2@urea in the 2,500-4,000 cm-1 range; (B) FTIR spectra of urea and Pb(NO3)2@urea in the 1,800-1,400 cm-1 range; (C) Surface tension of precursor solutions before and after the introduction of urea; (D) Contact angles of precursor solutions on NiOx substrates before and after the introduction of urea; (E) TGA curve of urea and Pb(NO3)2; (F) TG-MS profiles of the selected m/z = 17 and 44 signals during heating of urea under dry air; (G) Schematic illustration of the proposed multistep thermal transformation of urea. FTIR: Fourier transform infrared; TG-MS: thermogravimetry–mass spectrometry; TGA: thermogravimetric analysis; ITO: indium tin oxide.





