



fig4
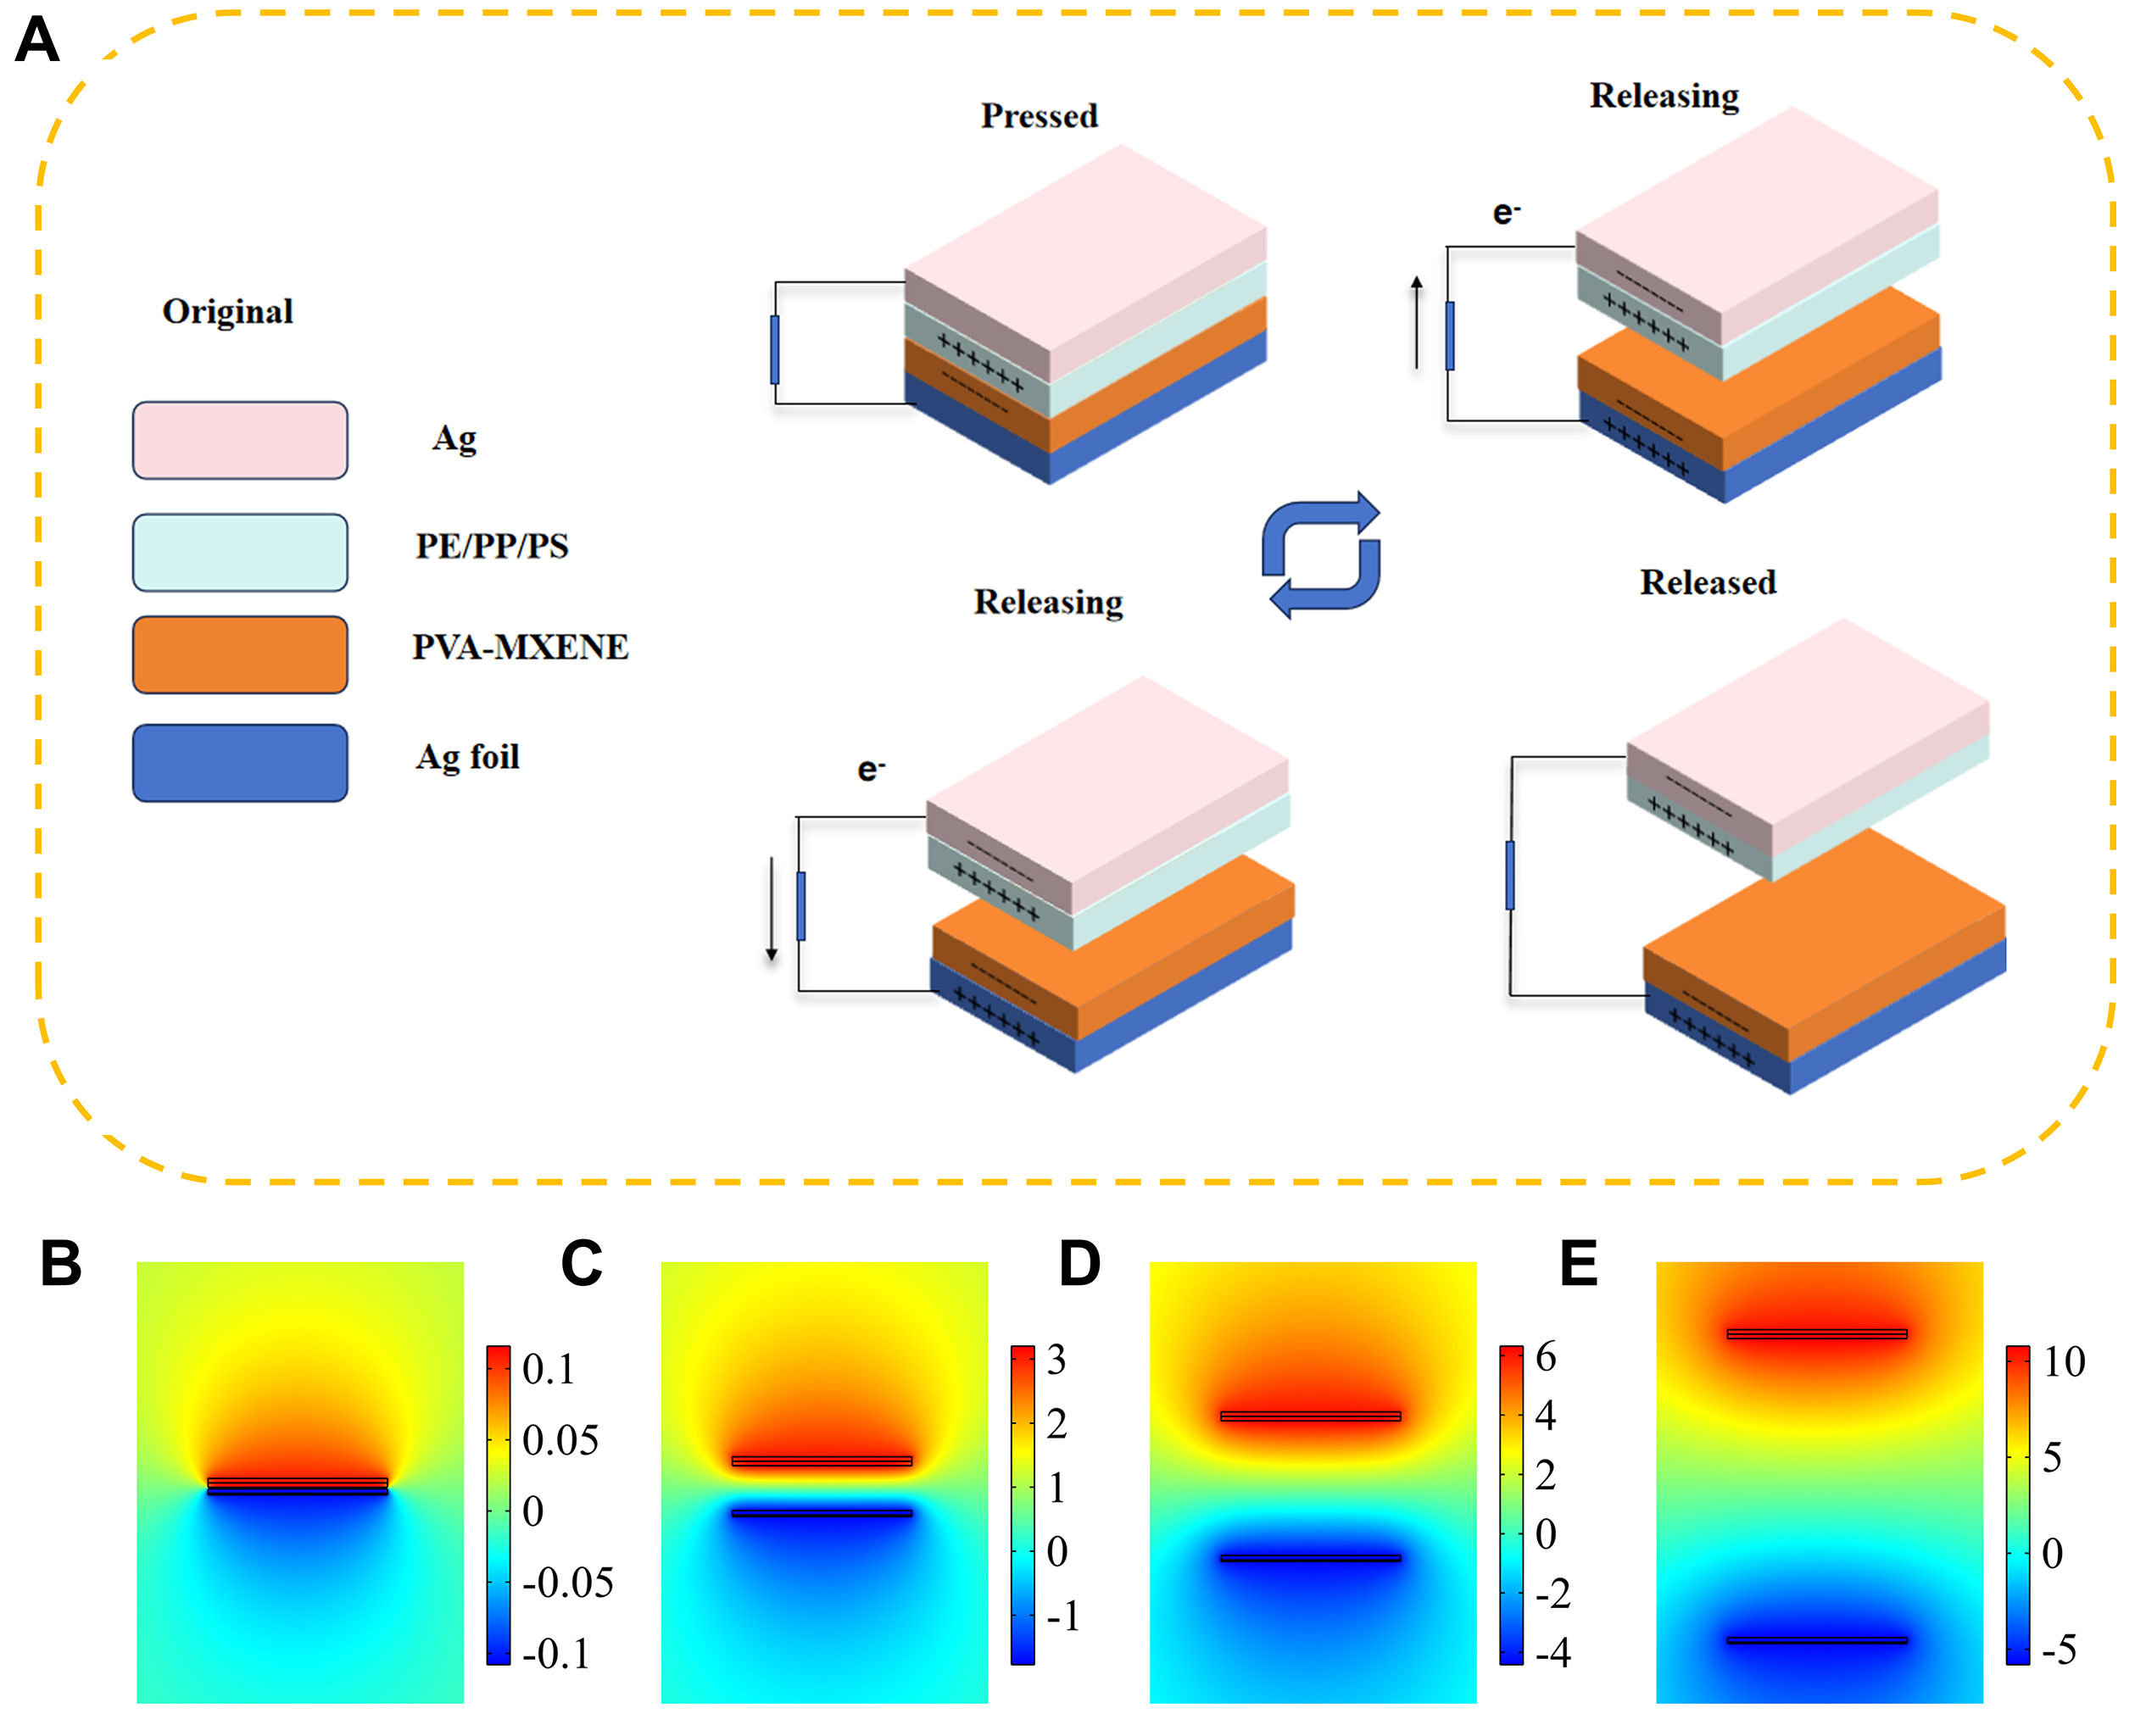
Figure 4. Experimental configuration and material screening. (A) Schematic diagram illustrating the experimental setup and working mechanism for triboelectric performance measurements. (B-E) Finite element method simulation of the triboelectric nanogenerator.