



fig8
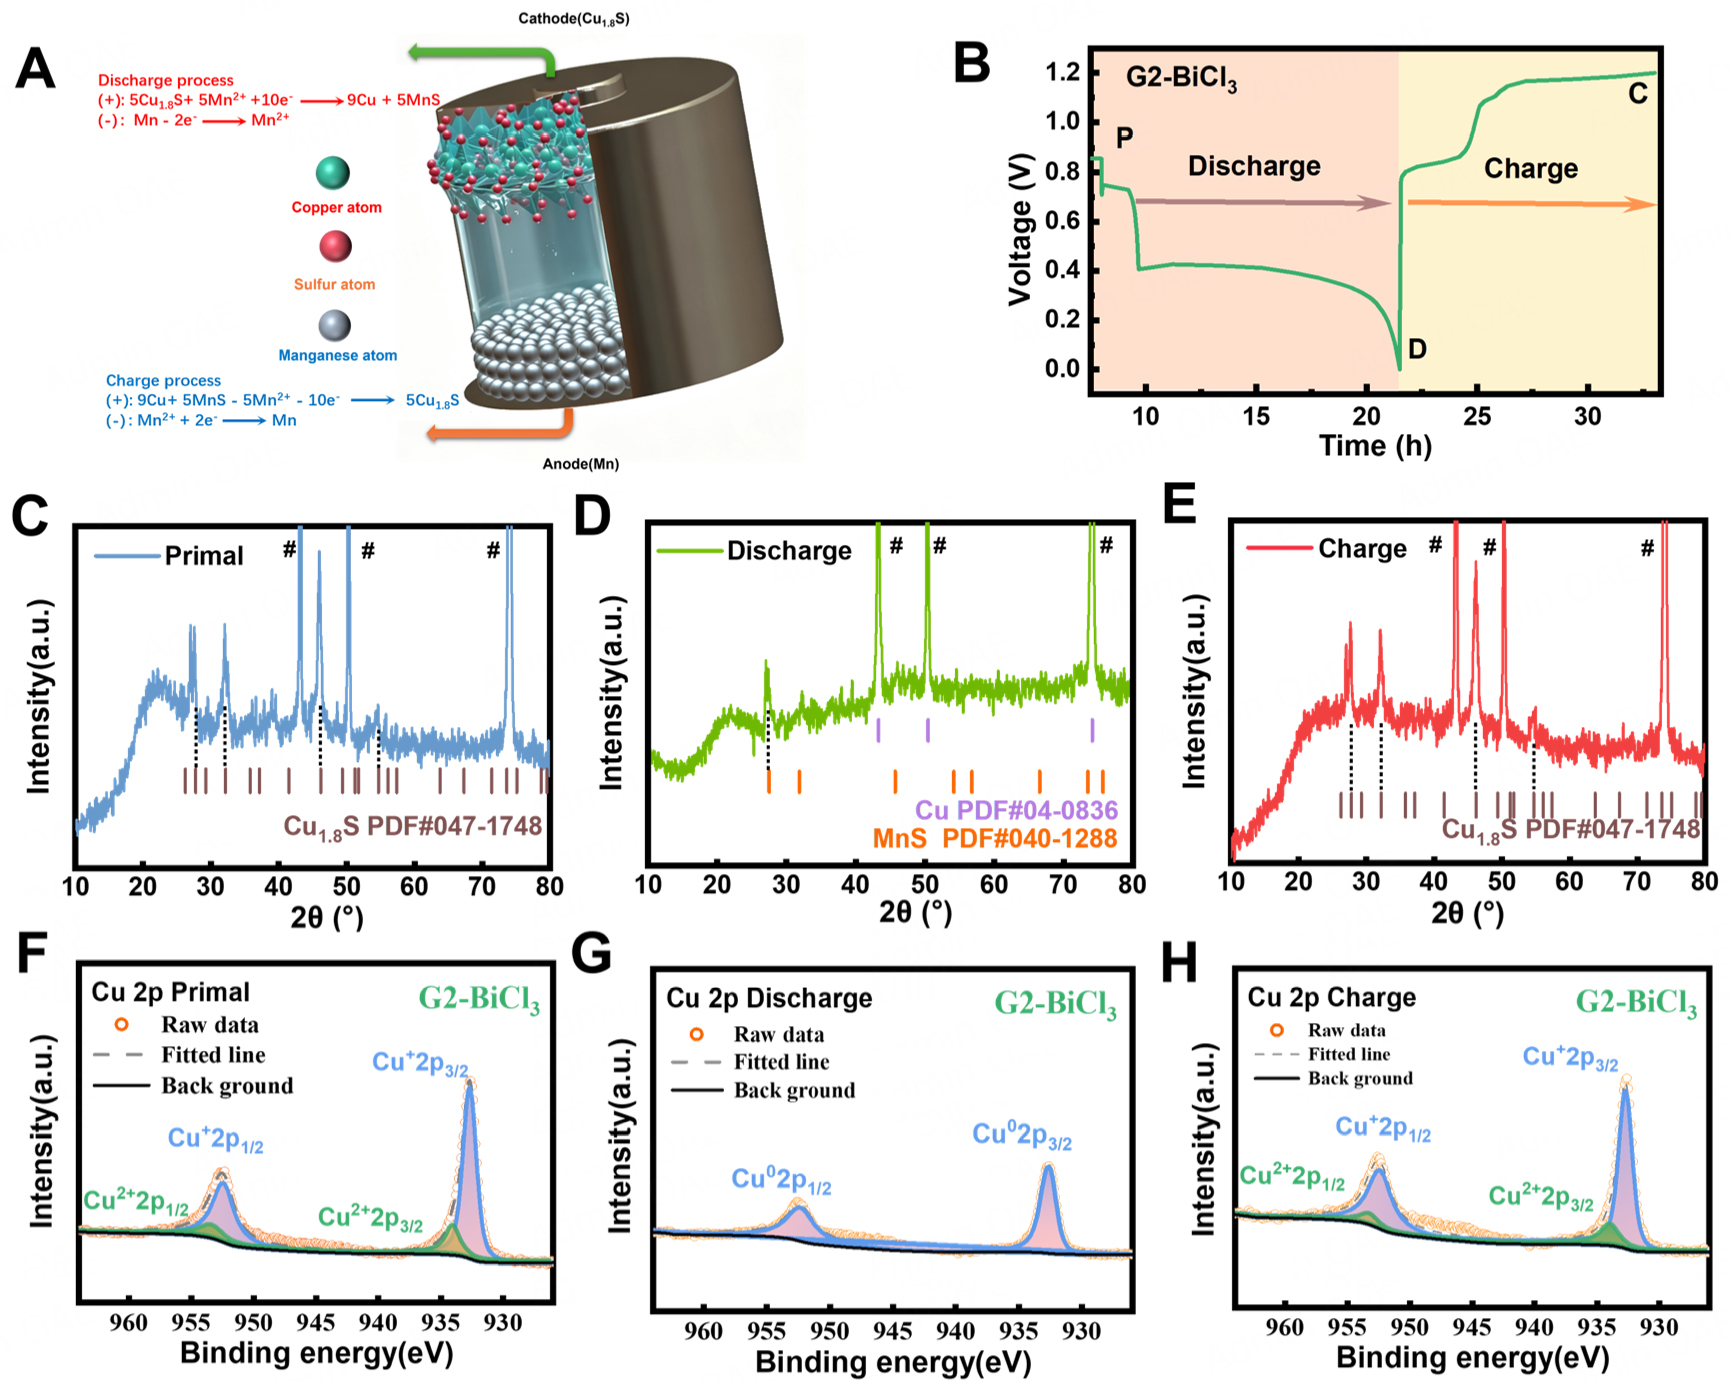
Figure 8. (A) Schematic representation of the internal conversion reaction mechanism in the Mn||Cu1.8S full cell; (B) Within the voltage range of 0 to 1.2 V, the GCD profile of the Mn||Cu1.8S full cell with G2-BiCl3 electrolyte, indicating the states designated for ex situ measurements; (C-E) Ex situ XRD patterns, the # marks in the figure correspond to the XRD of the Cu current collector; (F-H) Ex situ XPS spectra of the Mn||Cu1.8S full cells at the corresponding states.





