



fig7
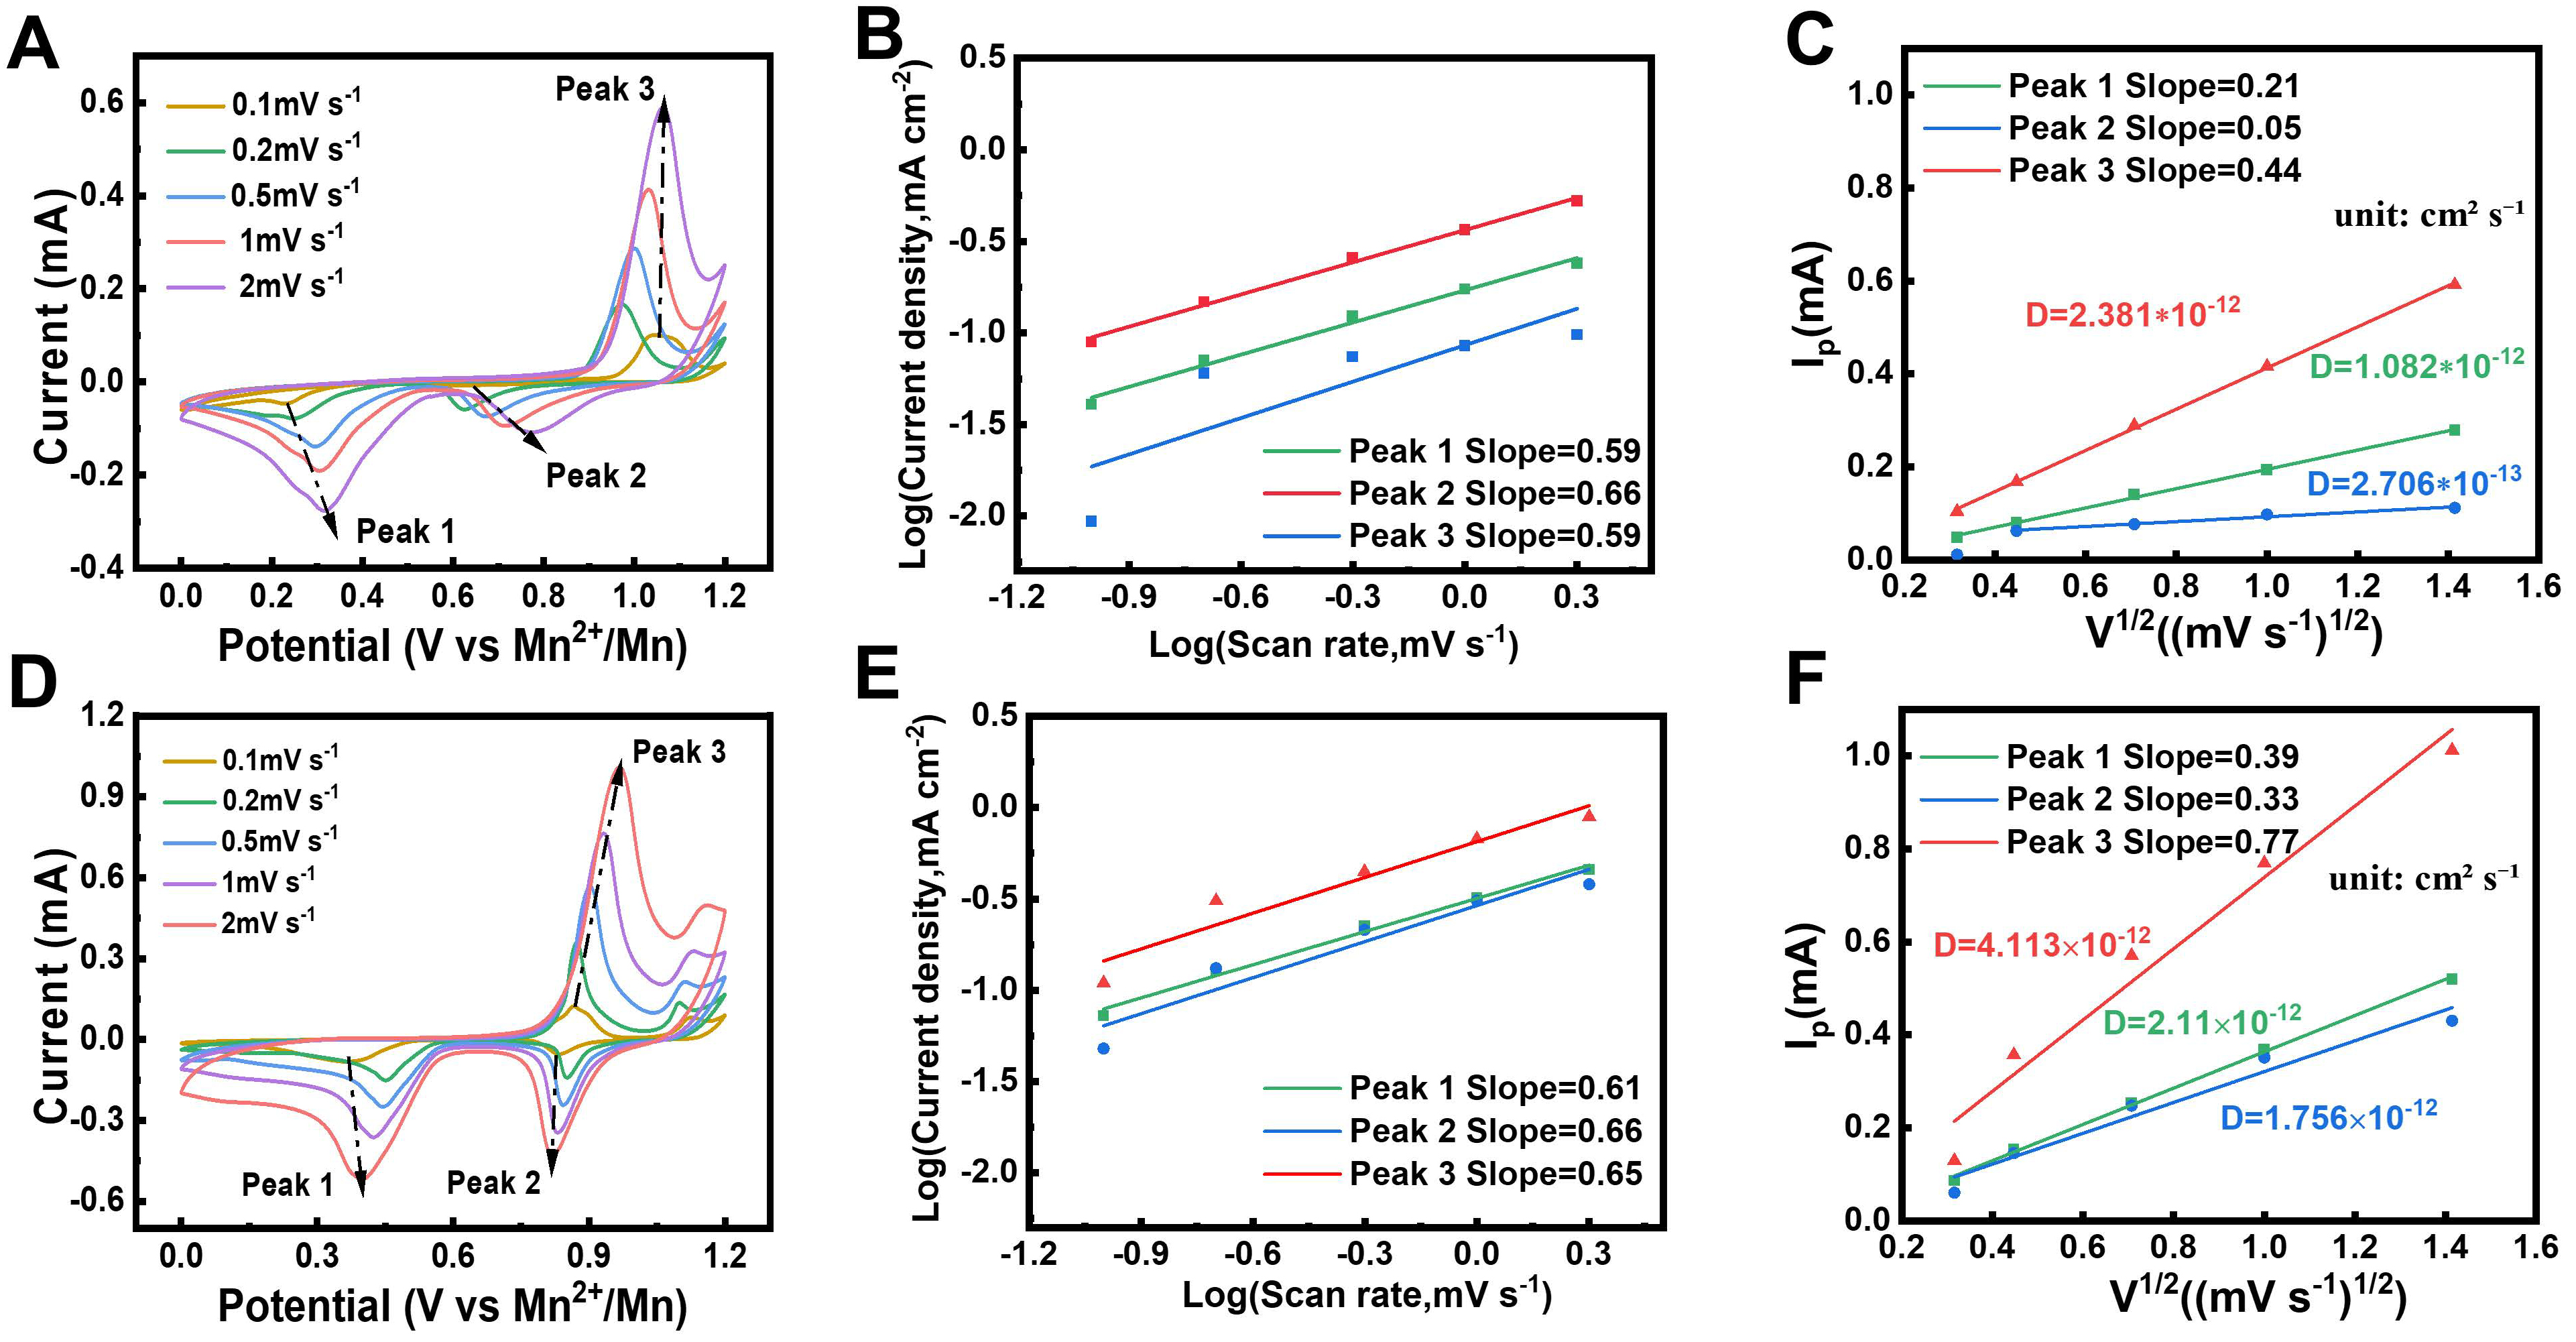
Figure 7. CV curves and kinetic analysis of Mn||Cu1.8S full cells in the G2-Mn(OTf)2 and G2-BiCl3 electrolytes. (A, D) CV curves at different scan rates; (B, E) Corresponding log(i) vs. log(v) plots used to determine the b values; (C, F) Peak current vs. v1/2 plots used to calculate the Mn2+ diffusion coefficient (D, cm2 s-1).





