



fig5
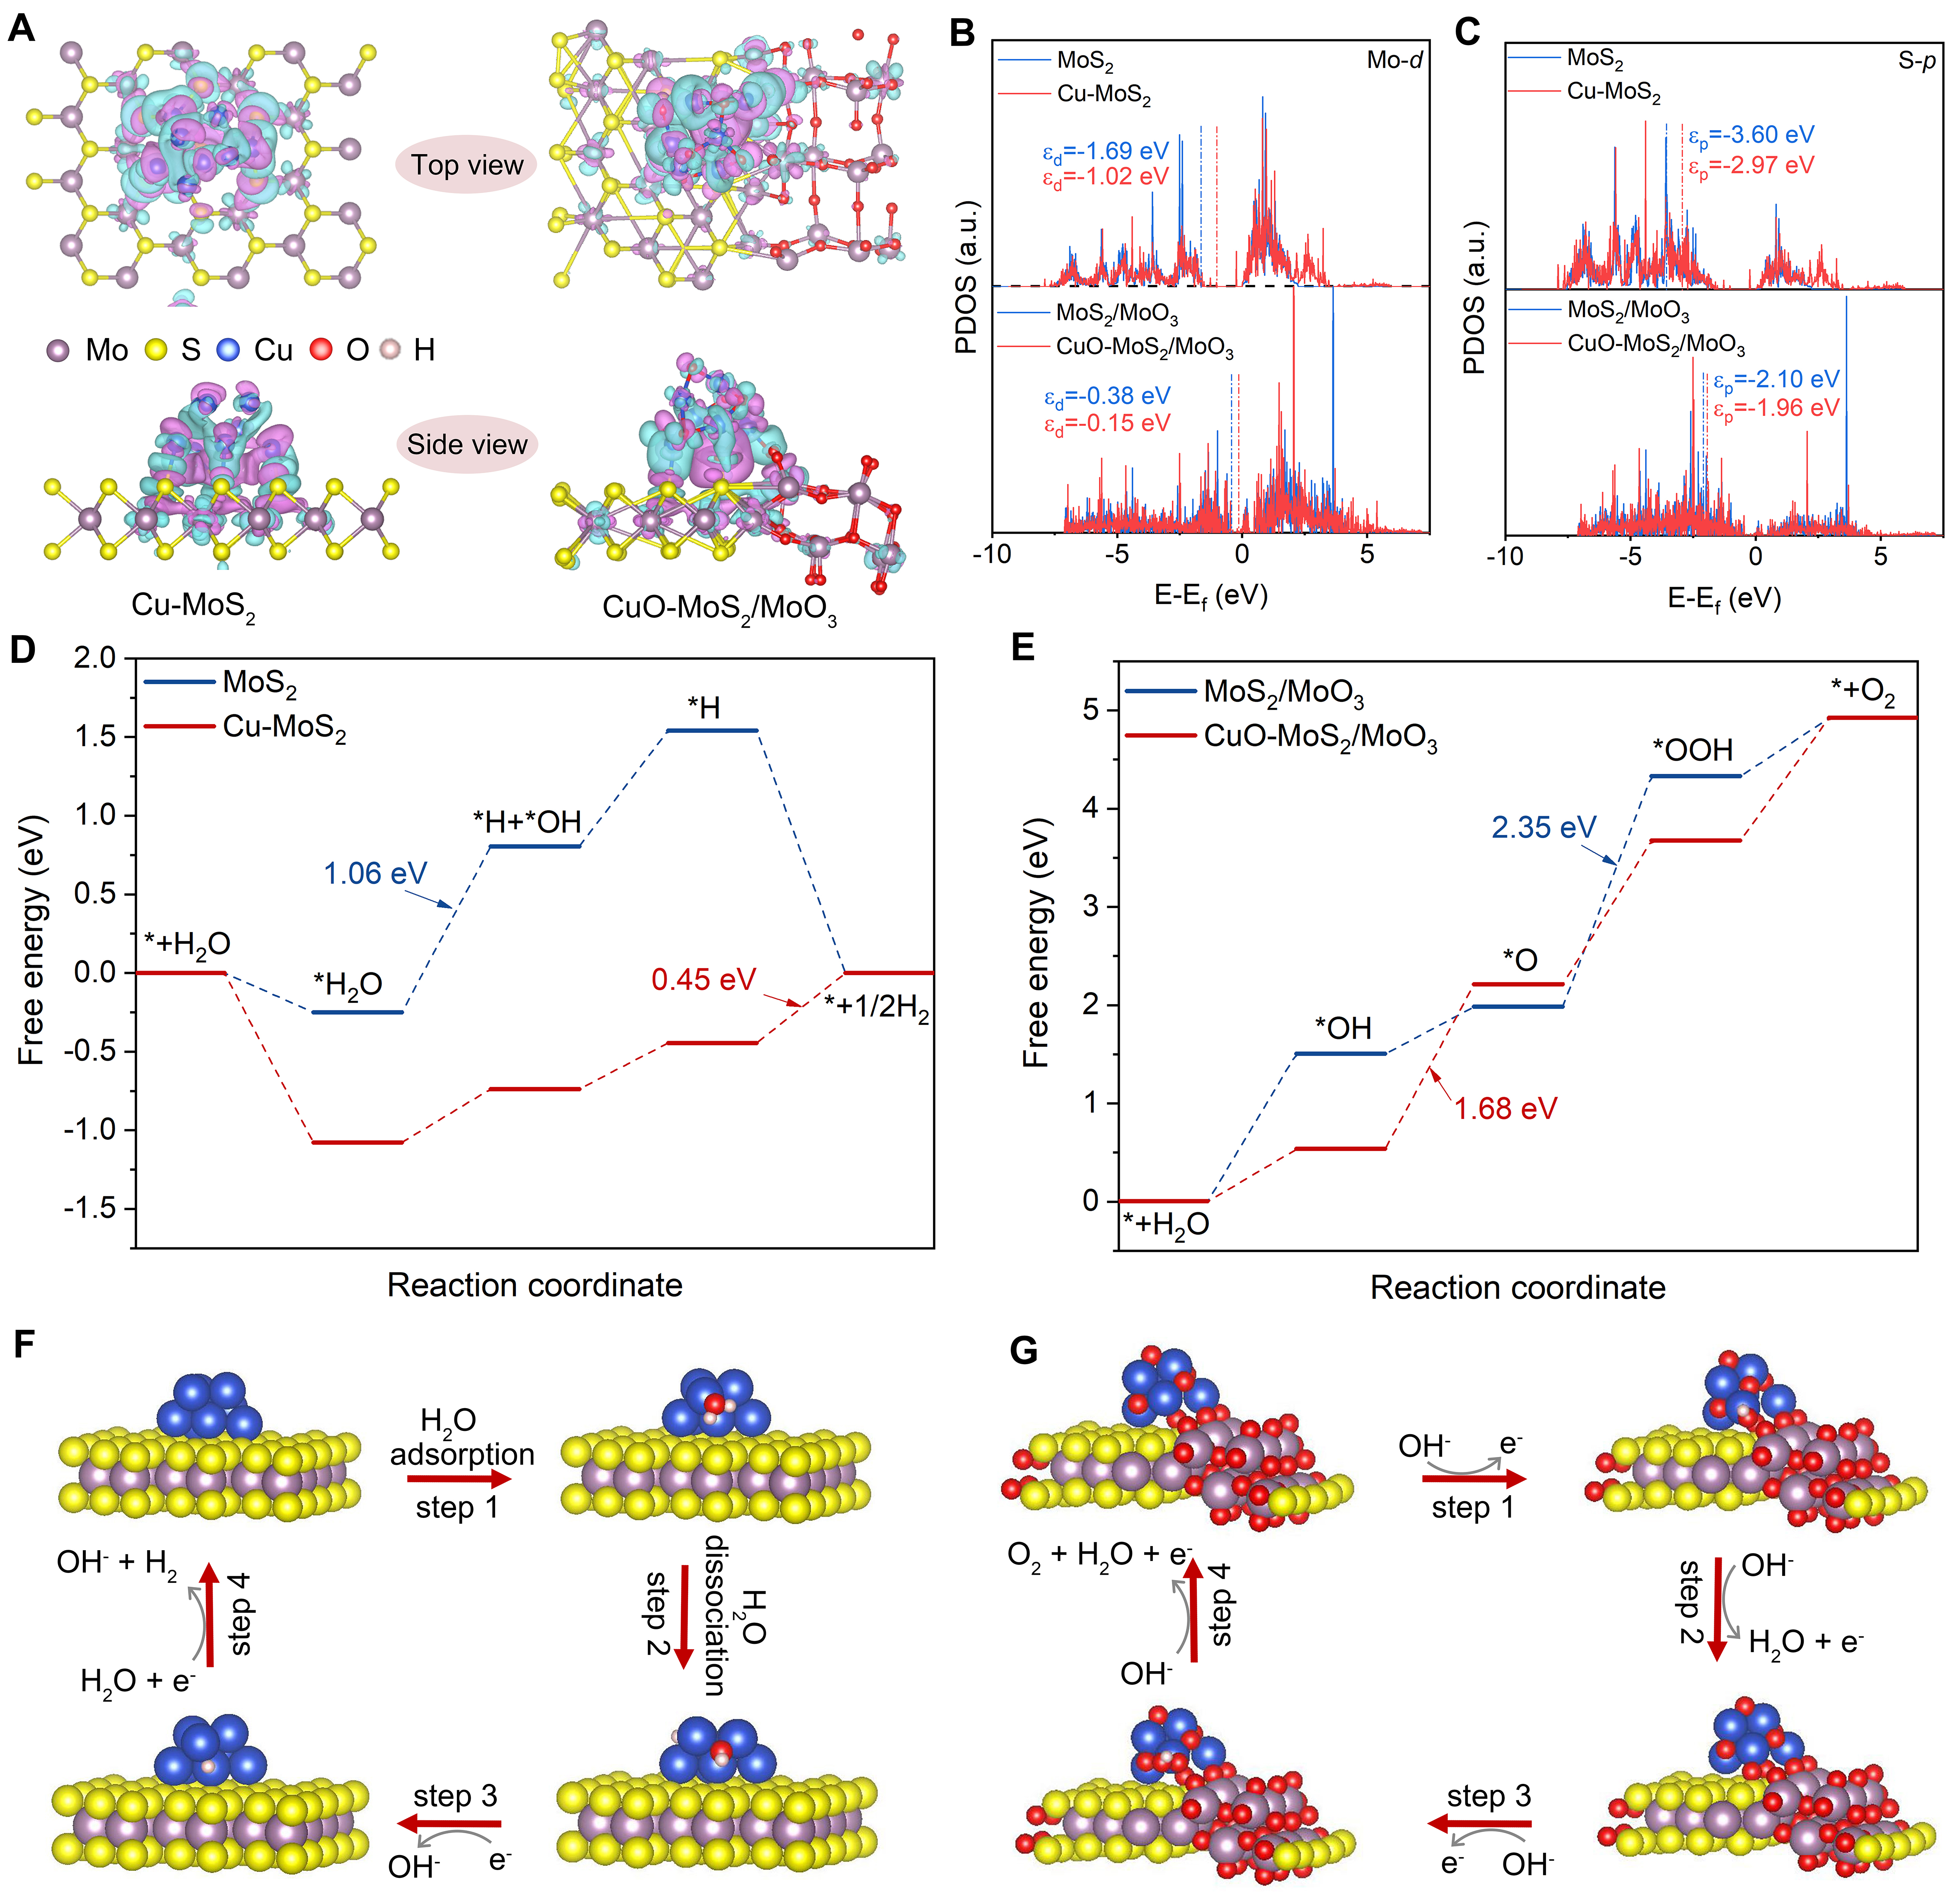
Figure 5. Theoretical investigation. (A) Differential charge density of Cu-MoS2 and CuO-MoS2/MoO3 model, purple and blue regions respectively, manifests the charge accumulation and depletion; The PDOS of (B) Mo-d and (C) S-p in the four catalyst models; Gibbs free energy diagram for (D) HER process on MoS2 and Cu-MoS2 (Cu-Mo interfacial site), and (E) OER process on MoS2/MoO3 and CuO-MoS2/MoO3 (CuO-MoS2/MoO3 interfacial site); Reaction pathways of (F) HER process on Cu-MoS2 at Cu-Mo interfacial site and (G) OER process on CuO-MoS2/MoO3 at CuO-MoS2/MoO3 interfacial site.





