



fig3
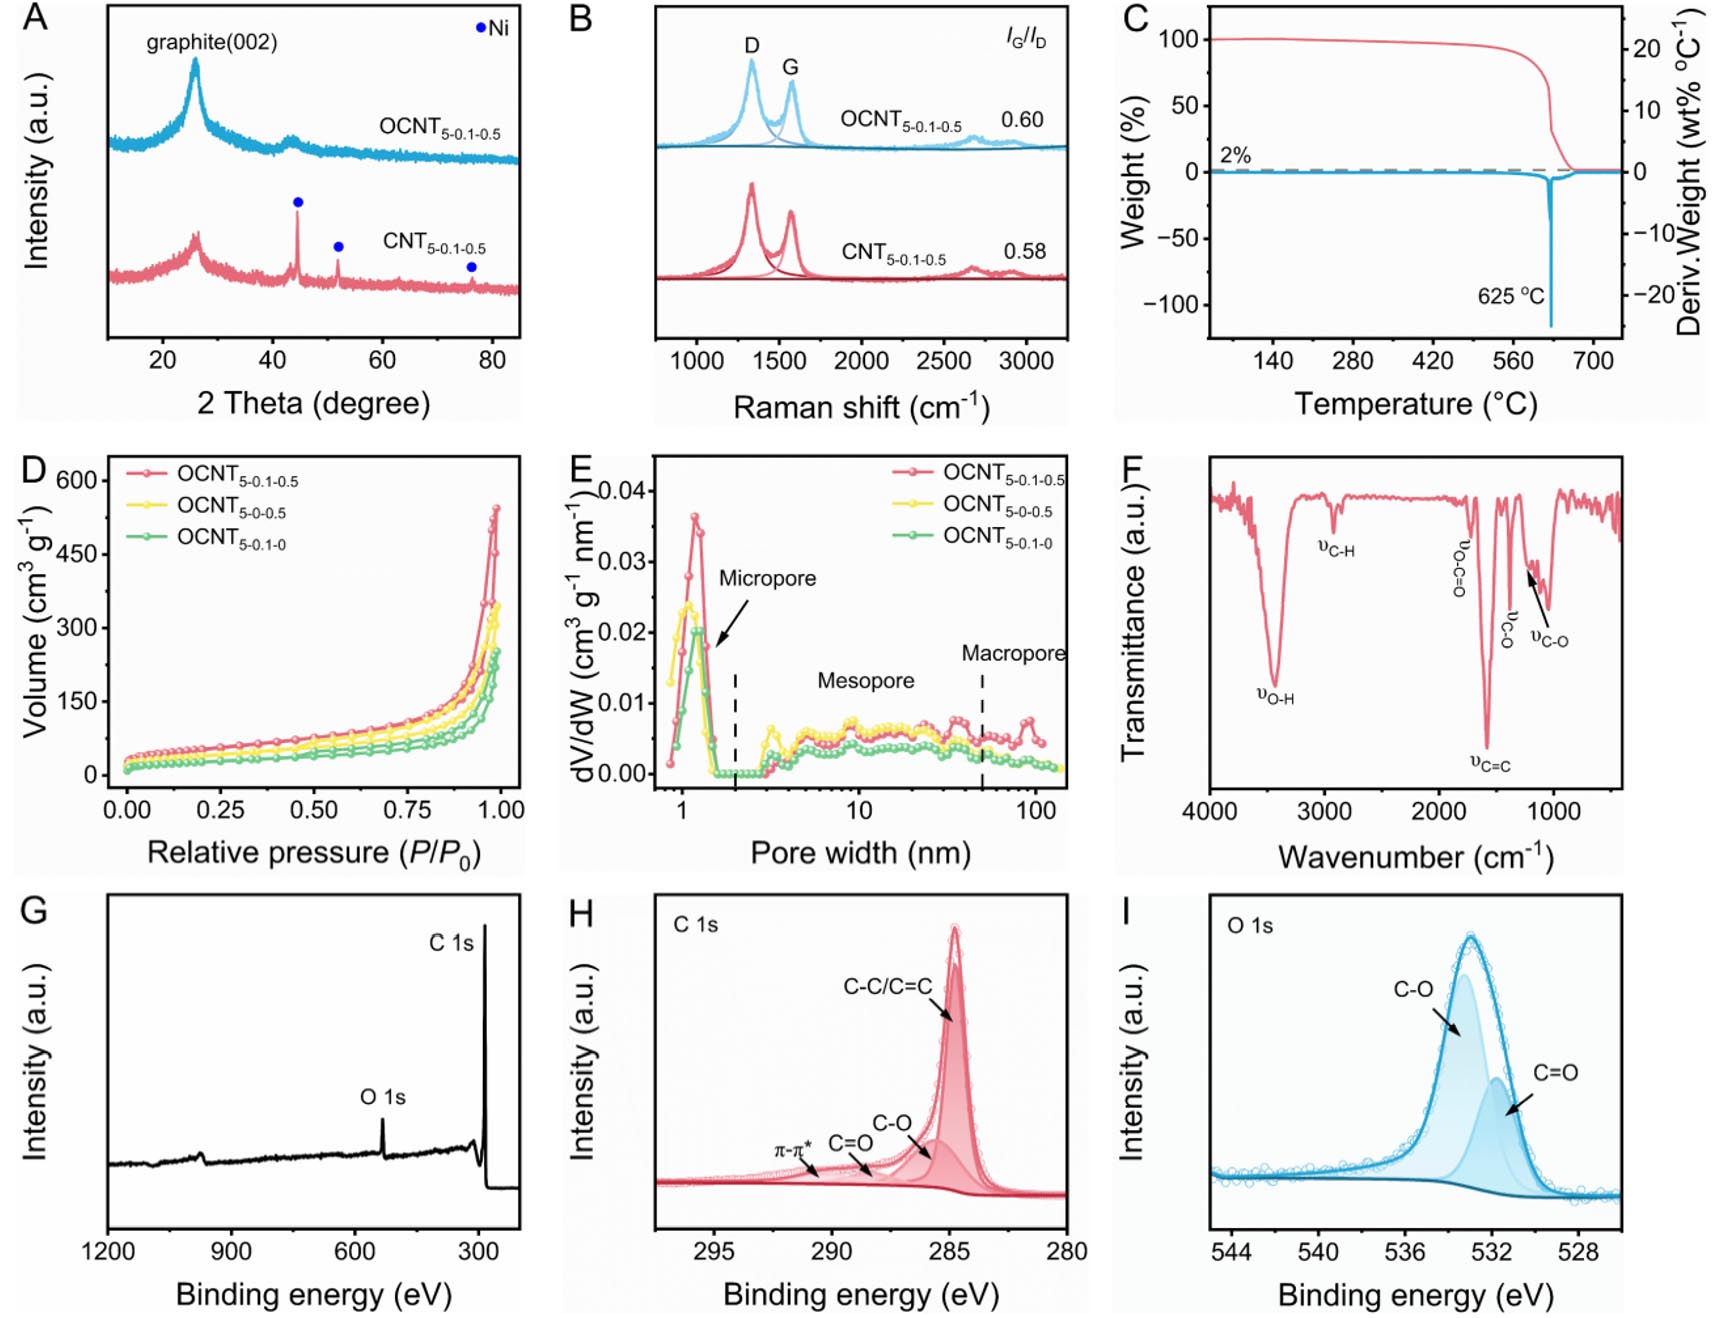
Figure 3. (A) XRD profiles and (B) Raman patterns of OCNT5-0.1-0.5 and CNT5-0.1-0.5. (C) Thermal gravimetric analysis (TGA) and derivative thermogravimetry (DTG) curves of OCNT5-0.1-0.5. (D) N2 adsorption-desorption isotherms and (E) corresponding pore size distribution using the density functional theory (DFT) model of OCNT. (F) Fourier transform infrared spectroscopy (FT-IR), (G) X-ray photoelectron spectroscopy (XPS), high-resolution (H) C 1s, and (I) O 1s XPS spectra of OCNT5-0.1-0.5.





