


fig1
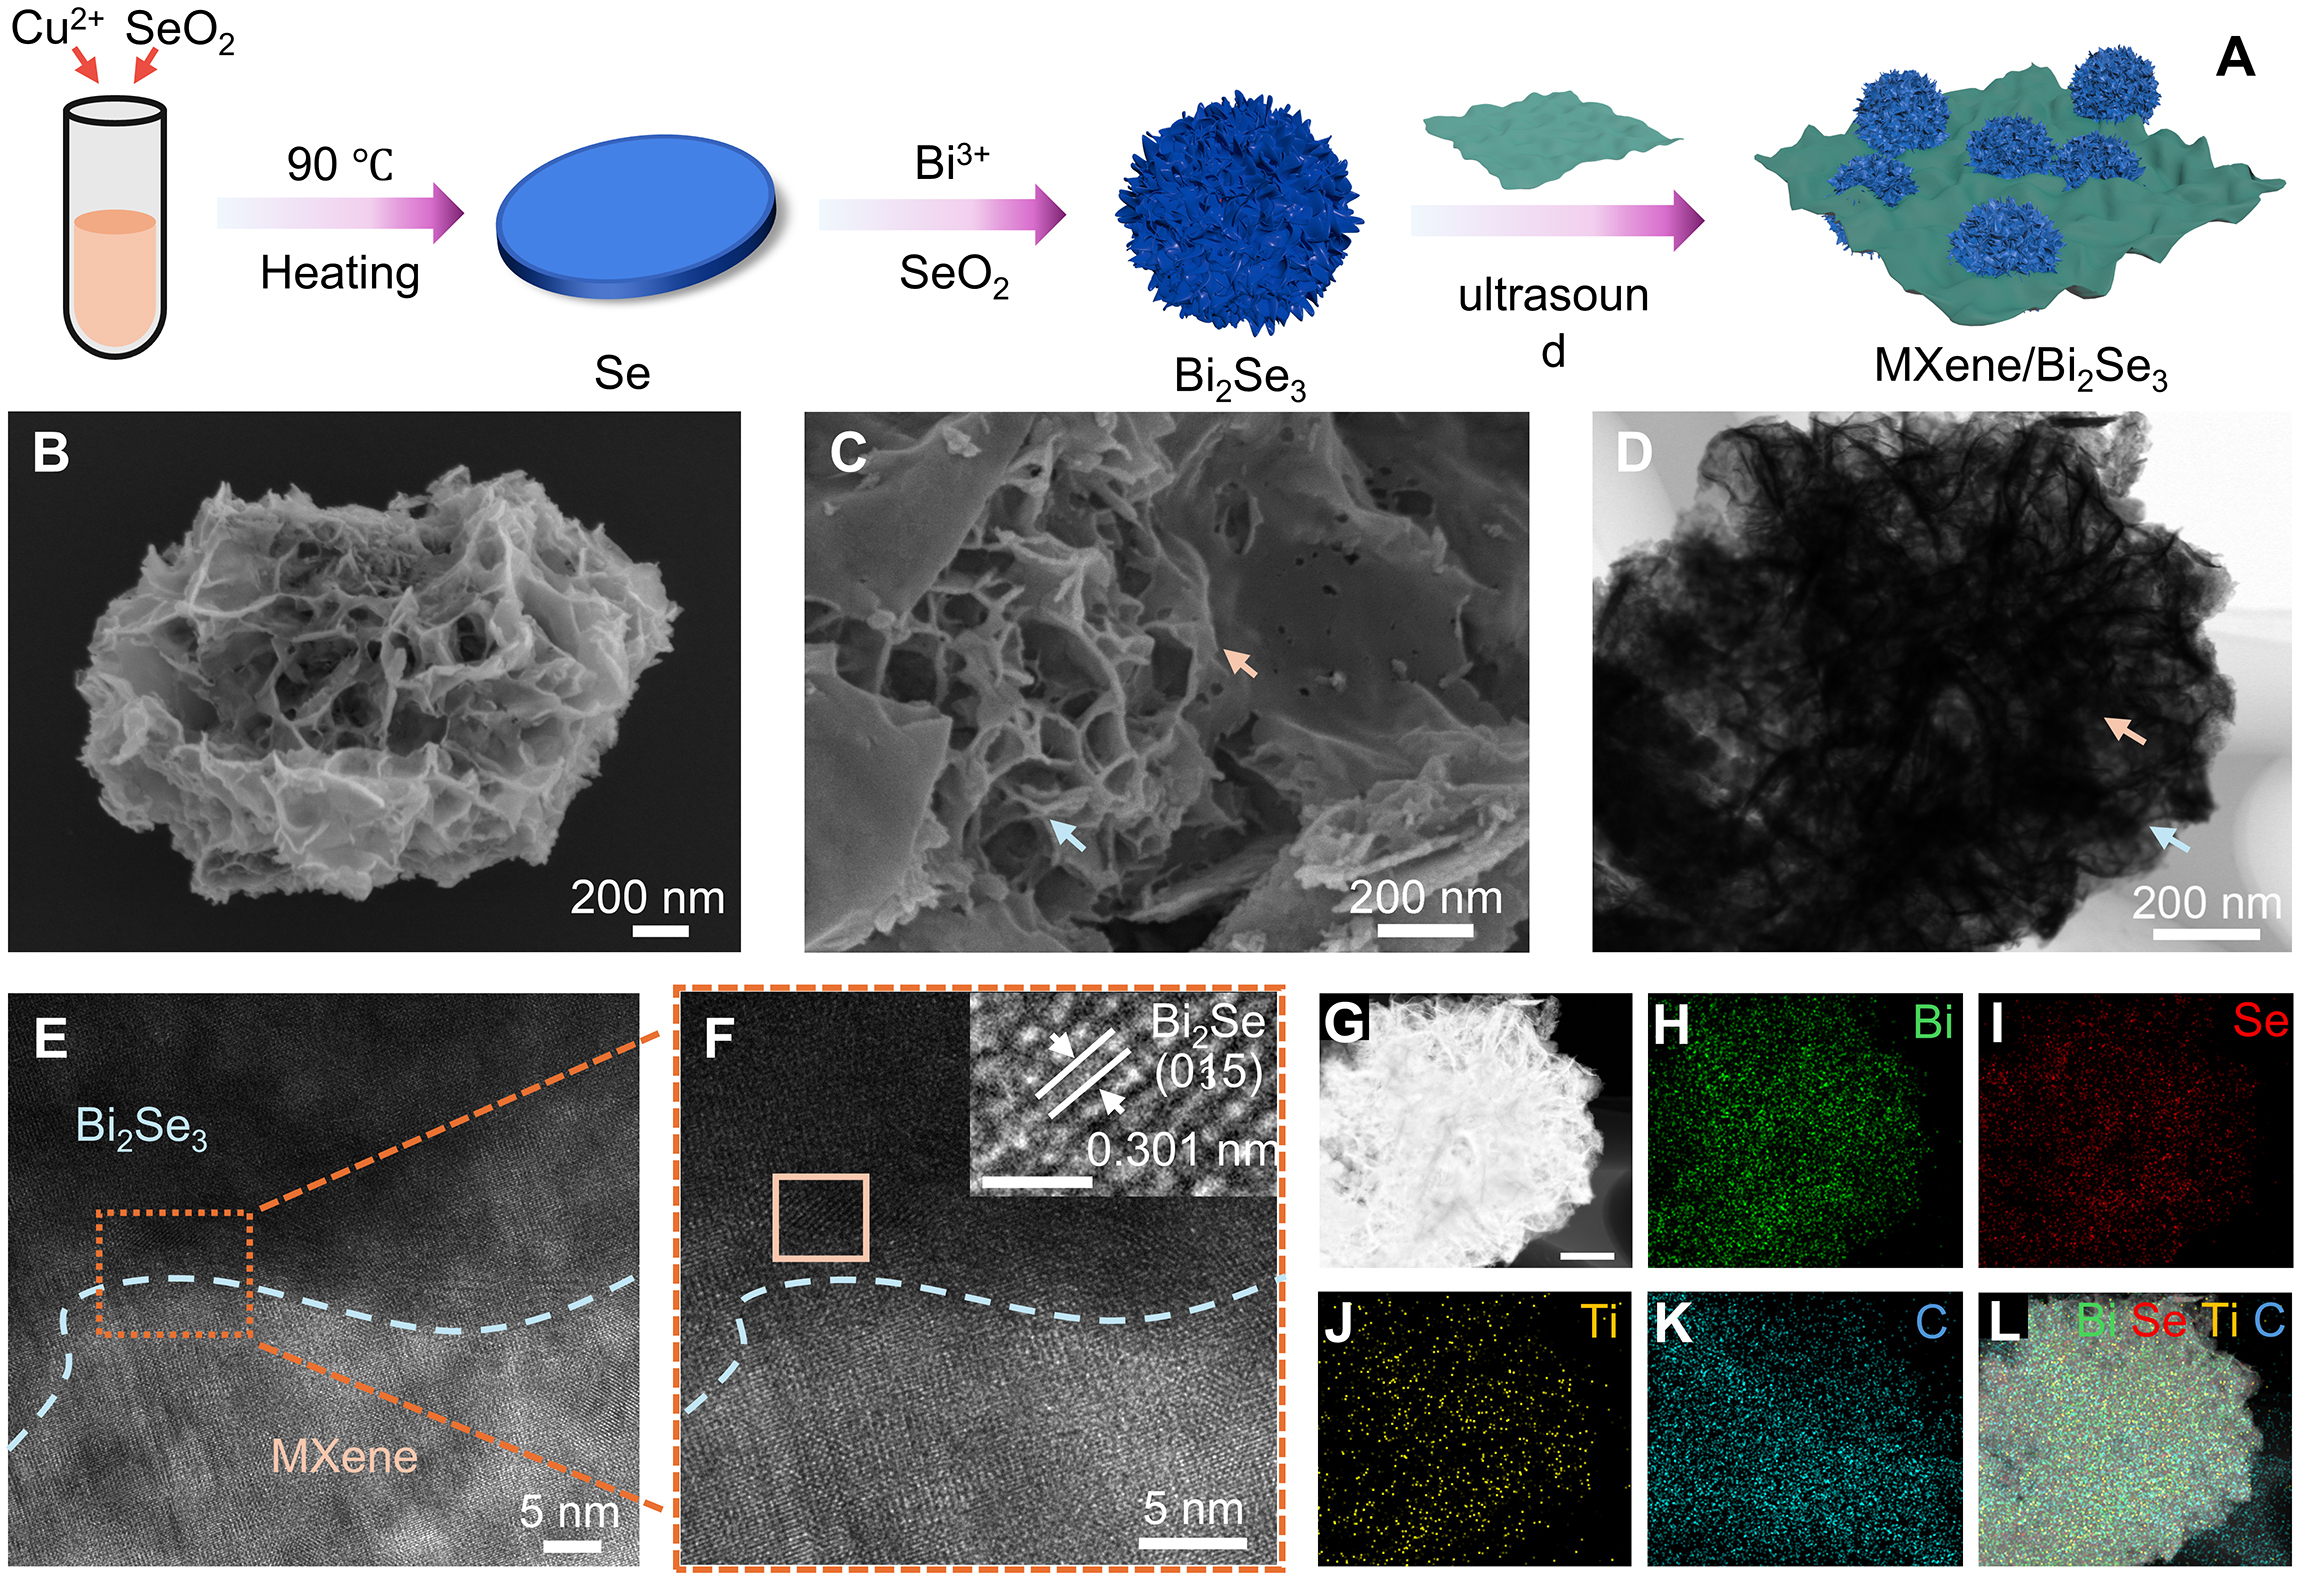
Figure 1. (A) Schematic illustration of the synthetic process of MXene/Bi2Se3. (B) SEM images of Bi2Se3 and (C) MXene/Bi2Se3. (D) TEM image, (E and F) HRTEM Images (The insert scalebar is 1 nm), (G) HAADF-STEM image (The insert scalebar is 20 nm), and (H-L) EDS mappings of MXene/Bi2Se3.


