


fig6
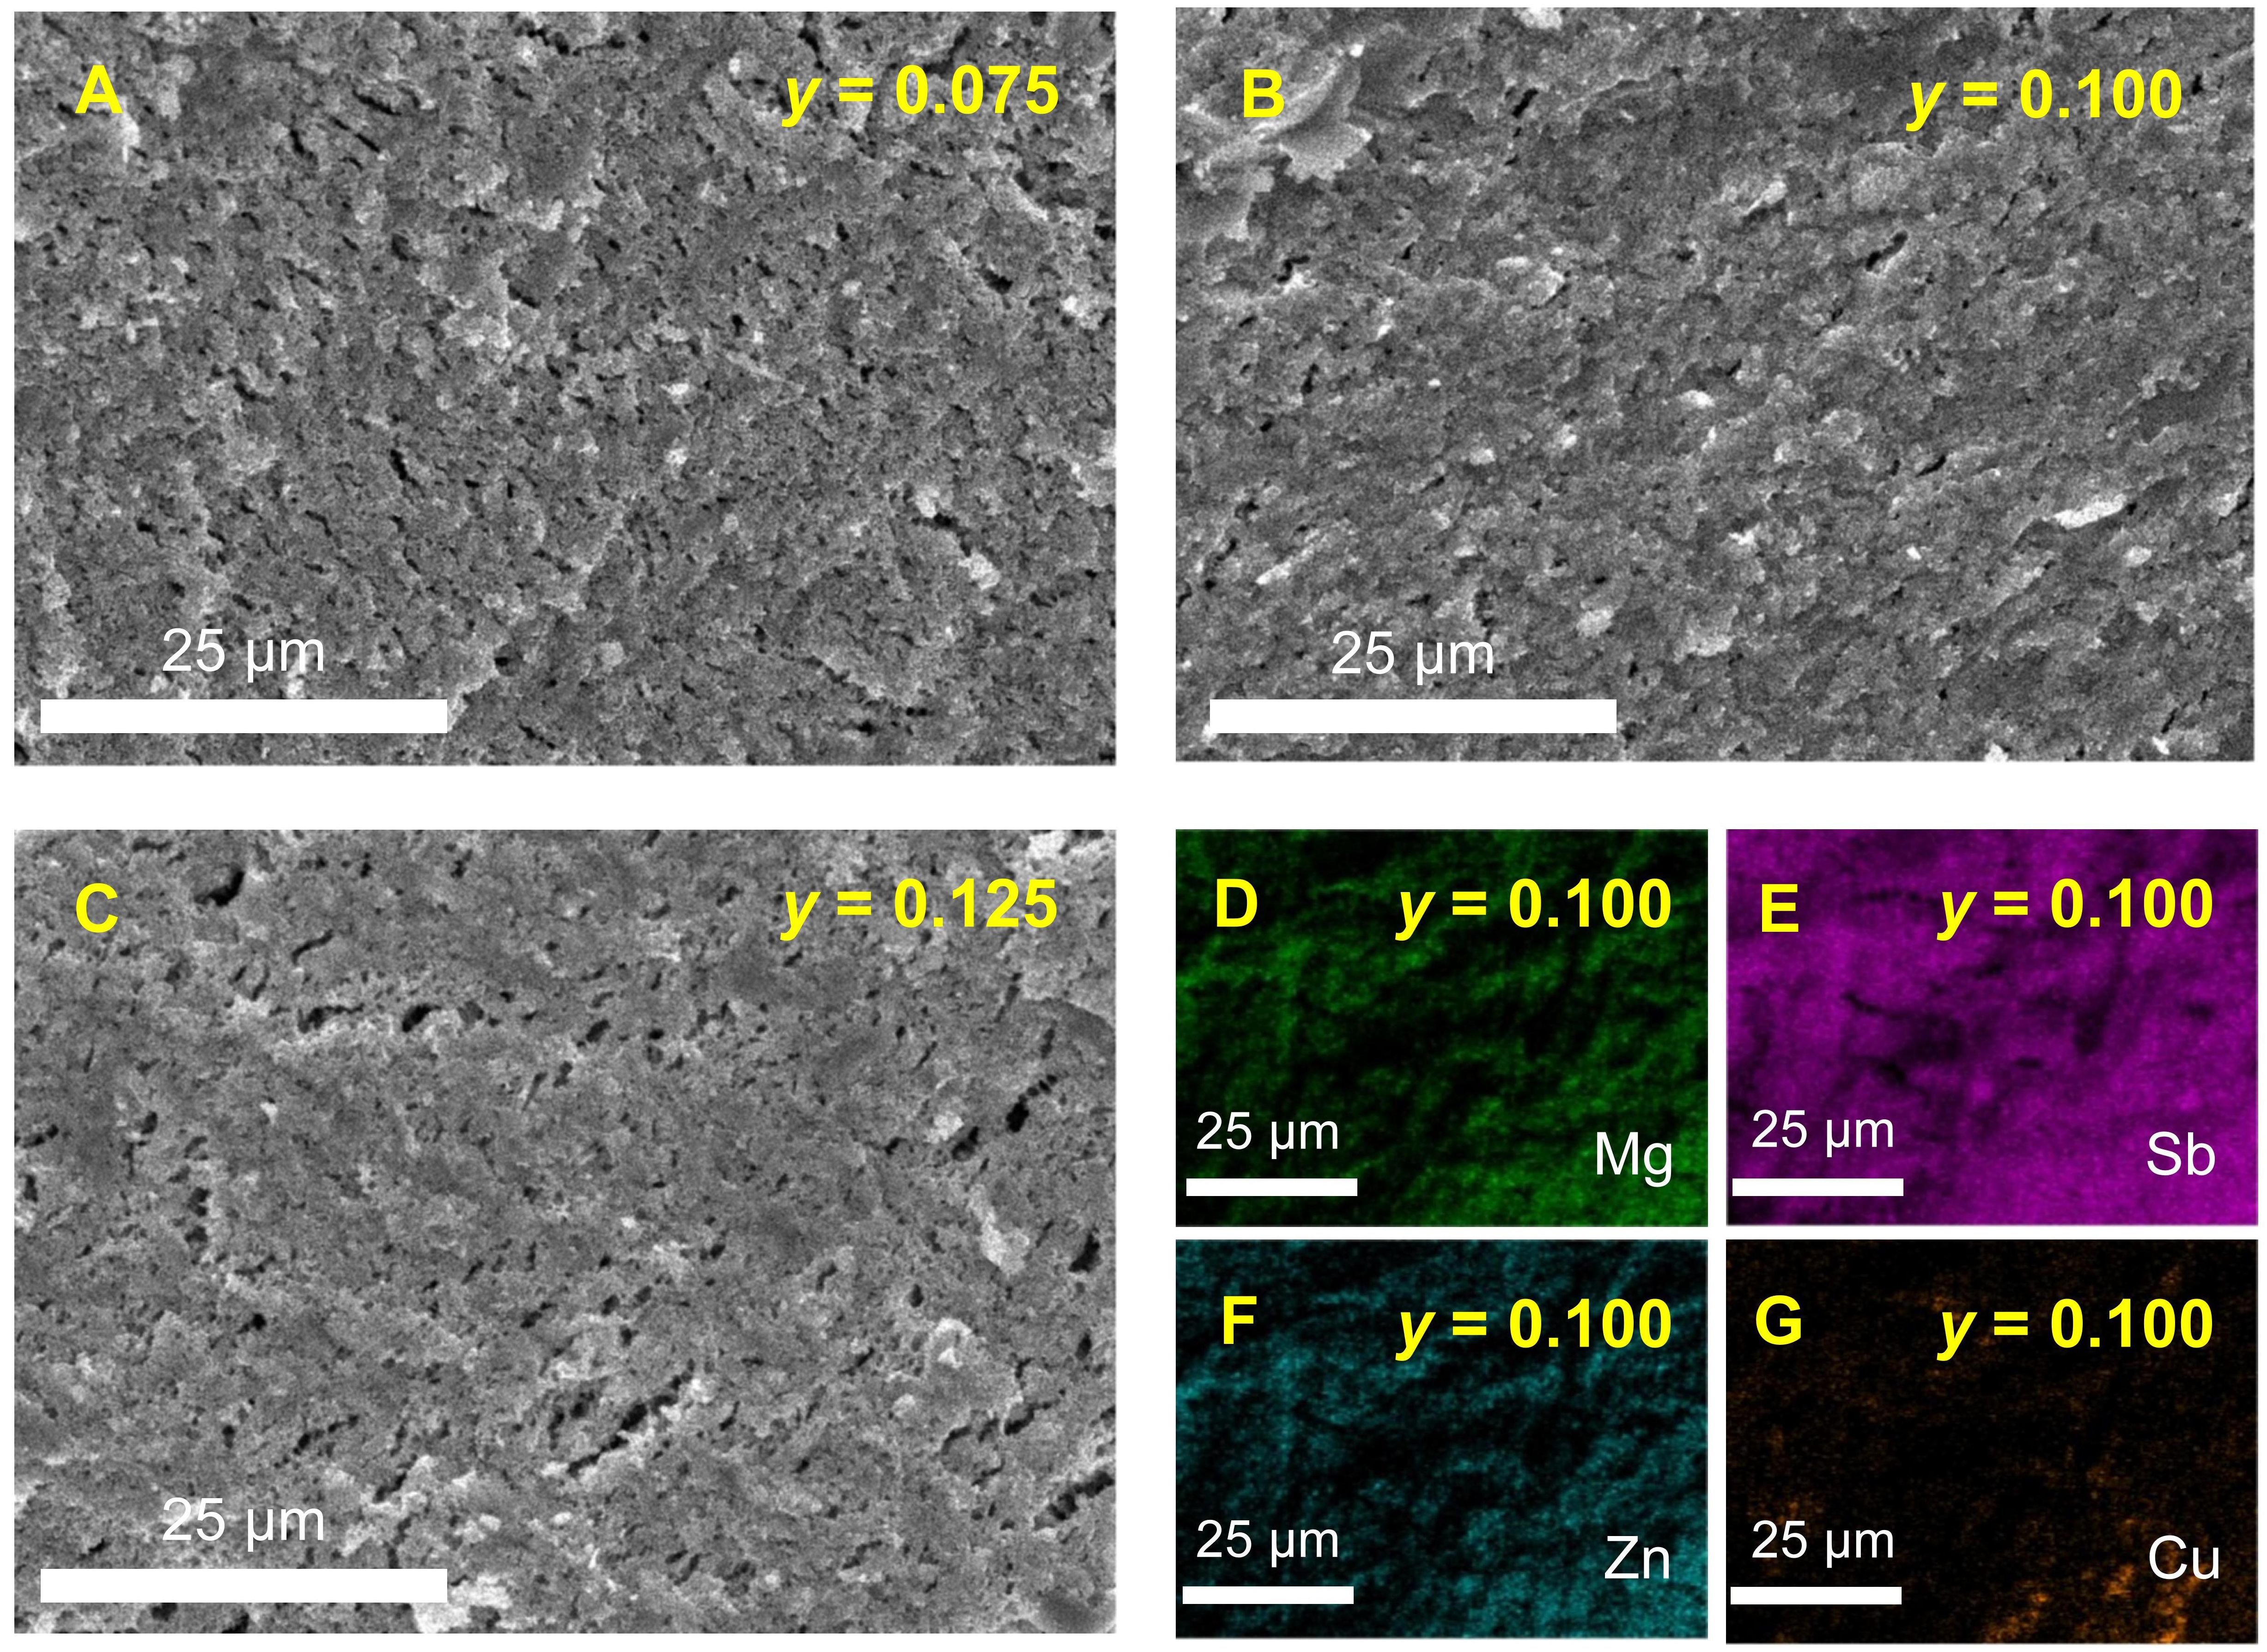
Figure 6. Microstructure of Mg2.3-yZn0.8CuySb2 (y = 0.075, 0.100, and 0.125). (A-C) SEM images for y = 0.075, 0.100, and 0.125; (D-G) EDS elemental mapping for the y = 0.100 sample. SEM: Scanning electron microscopy; EDS: energy-dispersive X-ray spectrometer.


