


fig5
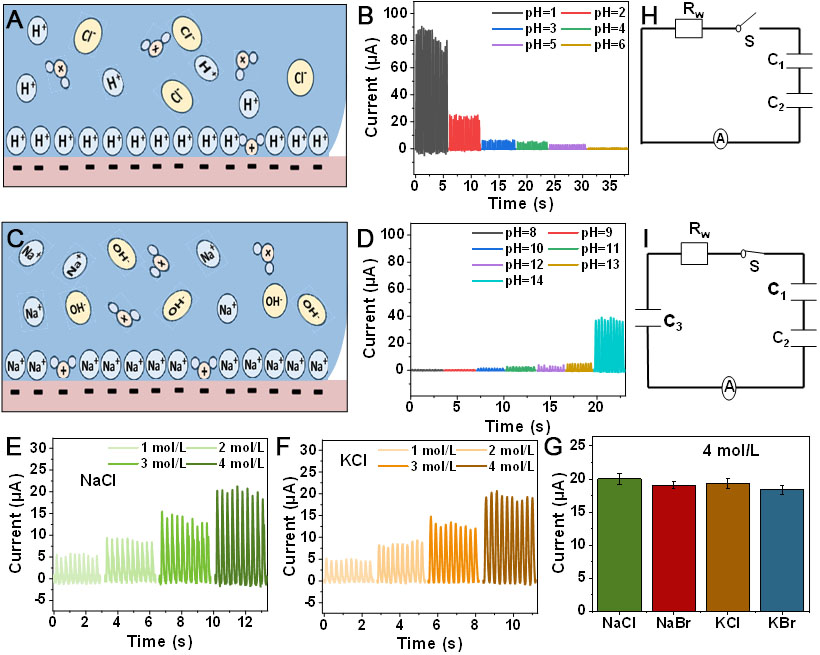
Figure 5. Mechanism of the electrical double layer (EDL) and ion concentration effects. The mechanism schematic (A) and current output (B) of acidic solutions at different pH values; The mechanism schematic (C) and current output (D) of alkaline solutions at different pH values; (E and F) respectively show the current output magnitudes of NaCl and KCl solutions at different molar concentrations; (G) illustrates the current output magnitudes of 4 M NaCl, NaBr, KCl, and KBr solutions in the form of a bar chart. Error bars represent SD. Three independent replicate experiments were performed for each condition (n = 3); (H and I) The equivalent circuit schematics. SD: Standard deviation.


