


fig3
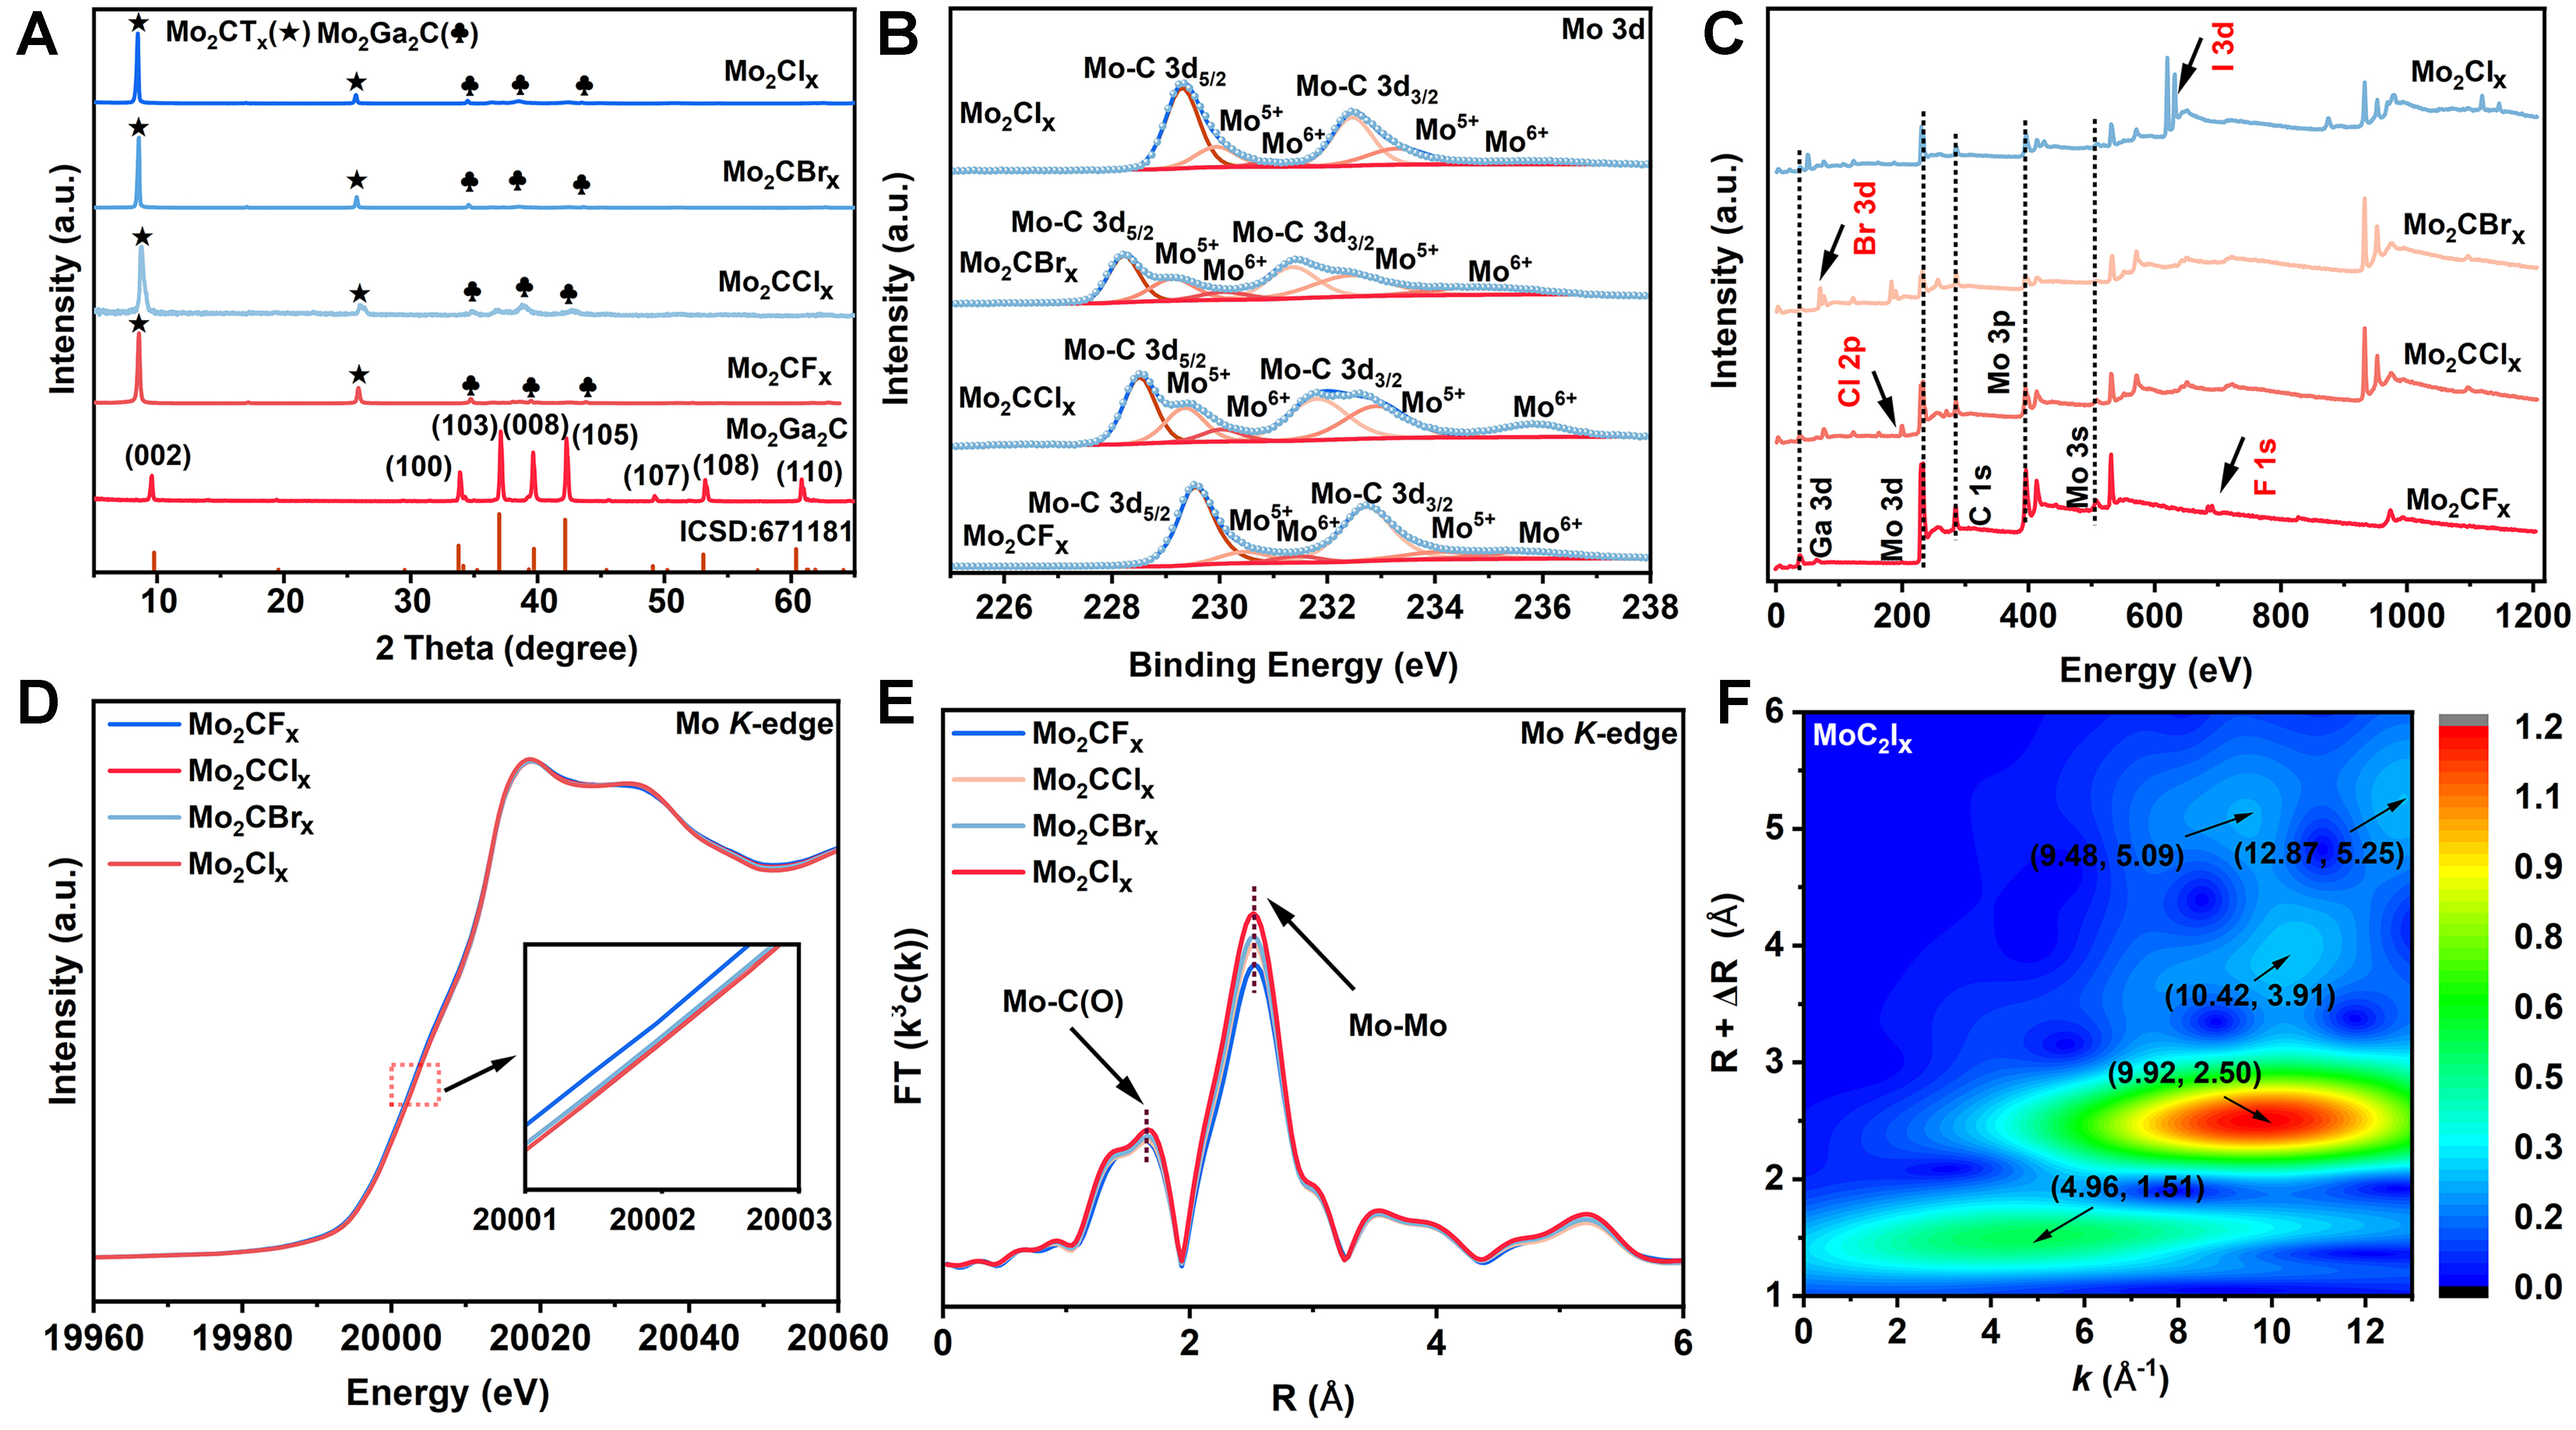
Figure 3. Spectroscopic analysis of the structure of surface-terminated Mo2CTx (T = F, Cl, Br, I) MXene. (A) XRD patterns; (B) XPS spectrum of Mo 3d; (C) XPS full spectrum; (D) Normalized XANES spectra of Mo K-edge; (E) FT-EXAFS of Mo K-edge; (F) WT of Mo2CIx. XRD: X-ray diffraction; XPS: X-ray photoelectron spectroscopy; XANES: X-ray absorption near-edge structure; FT-EXAFS: Fourier-transformed extended X-ray absorption fine structure; WT: wavelet transform.