



fig3
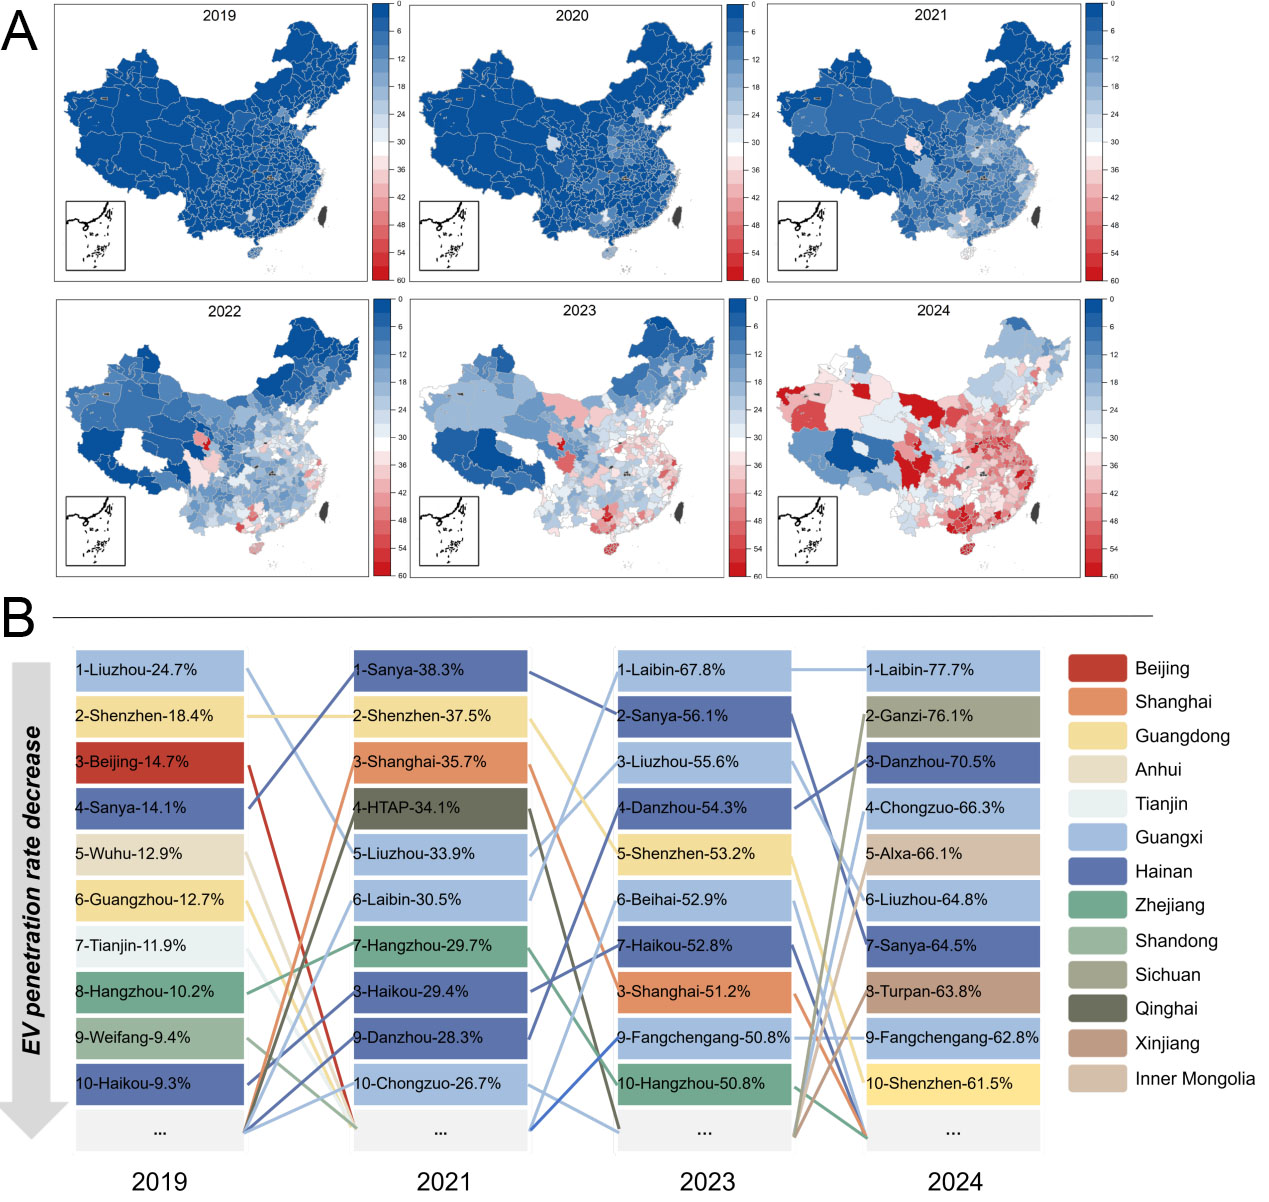
Figure 3. Temporal and spatial evolution of EV penetration across Chinese cities from 2019 to 2024. (A) Spatial distribution of city-level EV penetration. Color values are capped at 60% for visual clarity; cities exceeding this threshold (up to 77.7%) are displayed in the same maximum color category; (B) Top ten cities ranked by EV penetration rate in selected years (2019, 2021, 2023, and 2024). Cities with fewer than 1,000 annual EV sales were excluded. HTAP refers to Hainan Tibetan Autonomous Prefecture. Ganzi refers to Ganzi Tibetan Autonomous Prefecture. The base map in panel (A) was derived from the standard map of China approved under map approval number GS(2019)1822 and obtained from the Standard Map Service System of the Ministry of Natural Resources of the People’s Republic of China(http://bzdt.ch.mnr.gov.cn/download.html?searchText=GS(2019)1822). The base map boundaries were not modified. EV: Electric vehicle.





