



fig8
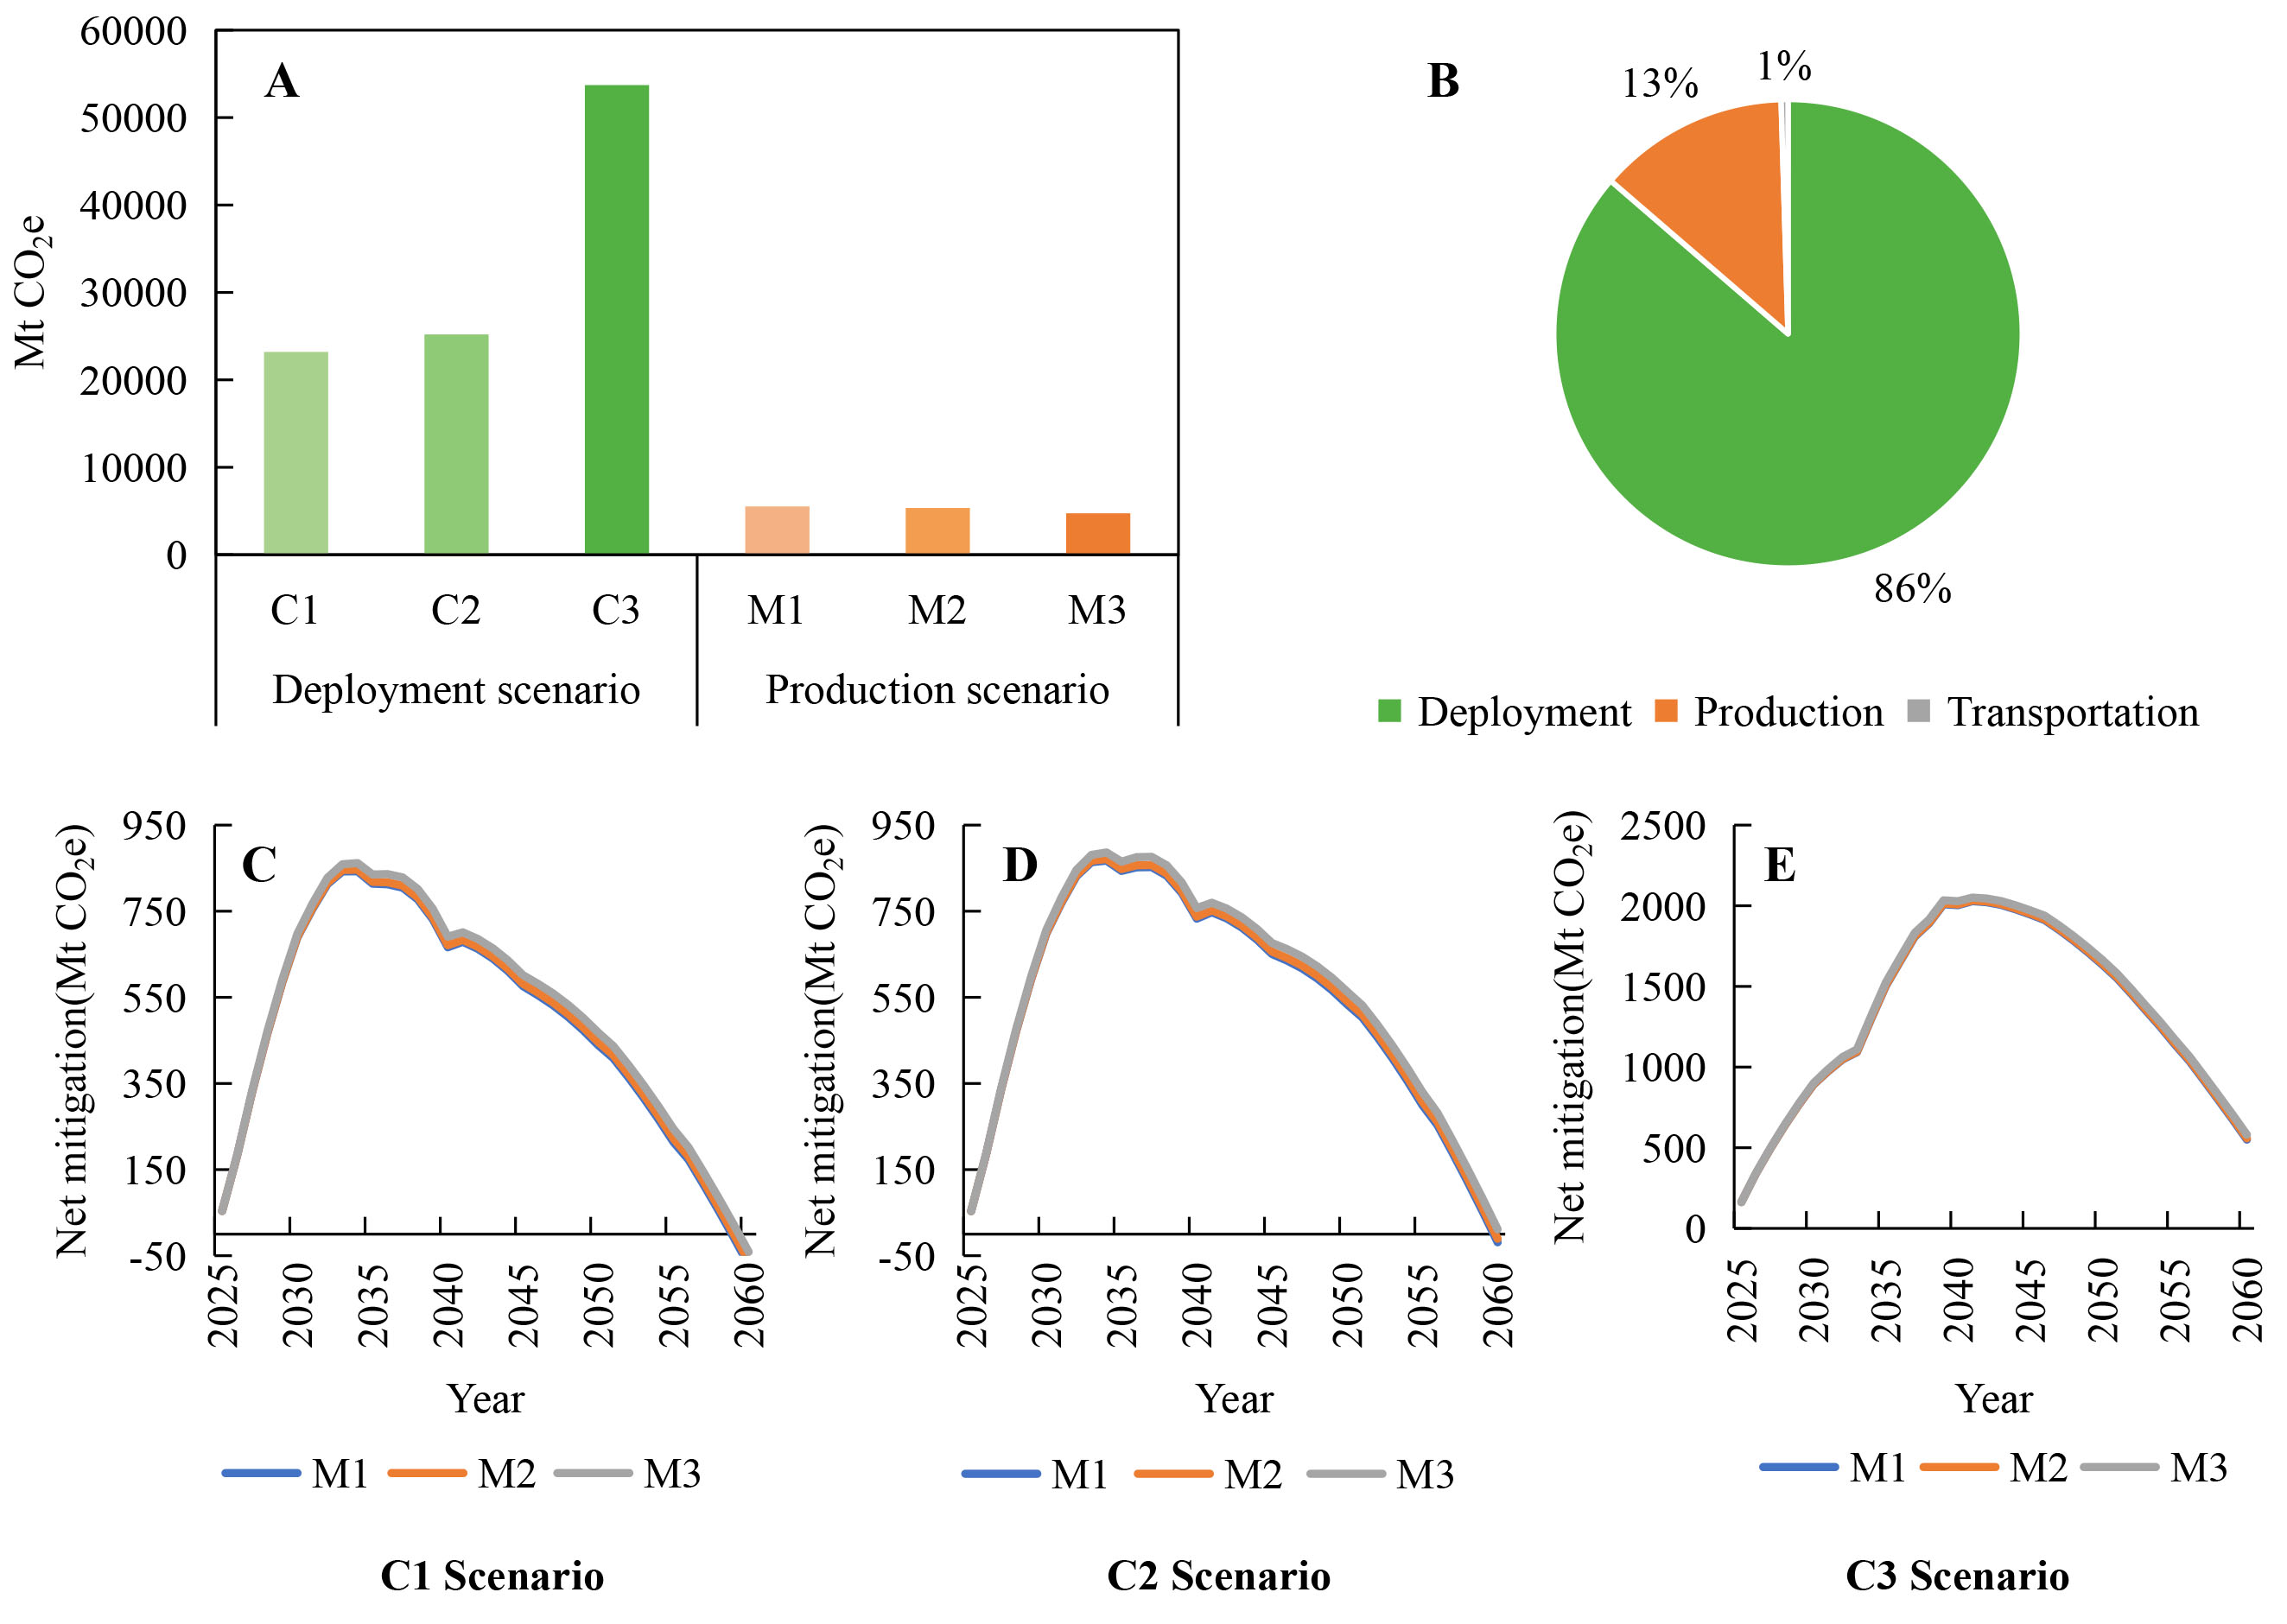
Figure 8. Integrated impacts of production-deployment scenarios. (A) Comparison of total impacts under different deployment and production scenarios; (B) Average contribution of deployment, production, and transportation stages; (C) Annual variation in net carbon mitigation benefits under the baseline deployment scenario (C1) from 2025 to 2060; (D) Annual variation in net carbon mitigation benefits under the balanced deployment scenario (C2) from 2025 to 2060; (E) Annual variation in net carbon mitigation benefits under the climate-priority deployment scenario (C3) from 2025 to 2060. The three production scenarios are baseline production scenario (M1), spatially diversified production scenario (M2), and clean-oriented production scenario (M3).





