



fig6
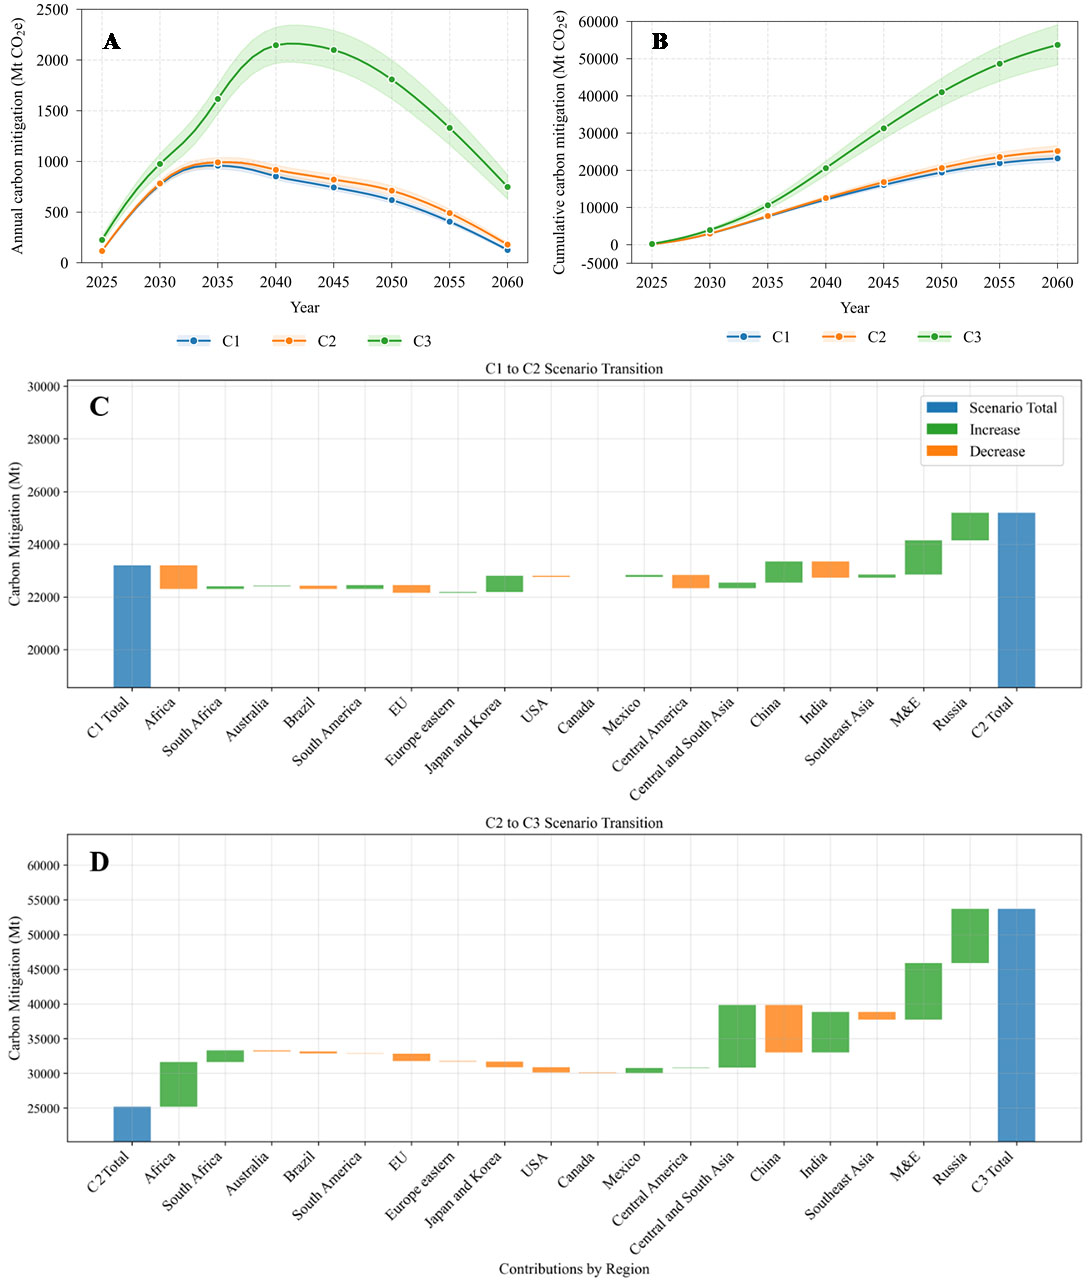
Figure 6. Comparison of global carbon mitigation across deployment scenarios. (A) Annual trends of net carbon mitigation benefits by scenarios (2025-2060); (B) Cumulative net carbon mitigation benefits by scenarios from 2025 to 2060; (C) Regional contributions to global net carbon mitigation benefits during the transition from scenario C1 to scenario C2. (D) Regional contributions to global net carbon mitigation benefits during the transition from scenario C2 to scenario C3. The three deployment scenarios are baseline deployment scenario (C1), balanced deployment scenario (C2), and climate-priority deployment scenario (C3).





