



fig5
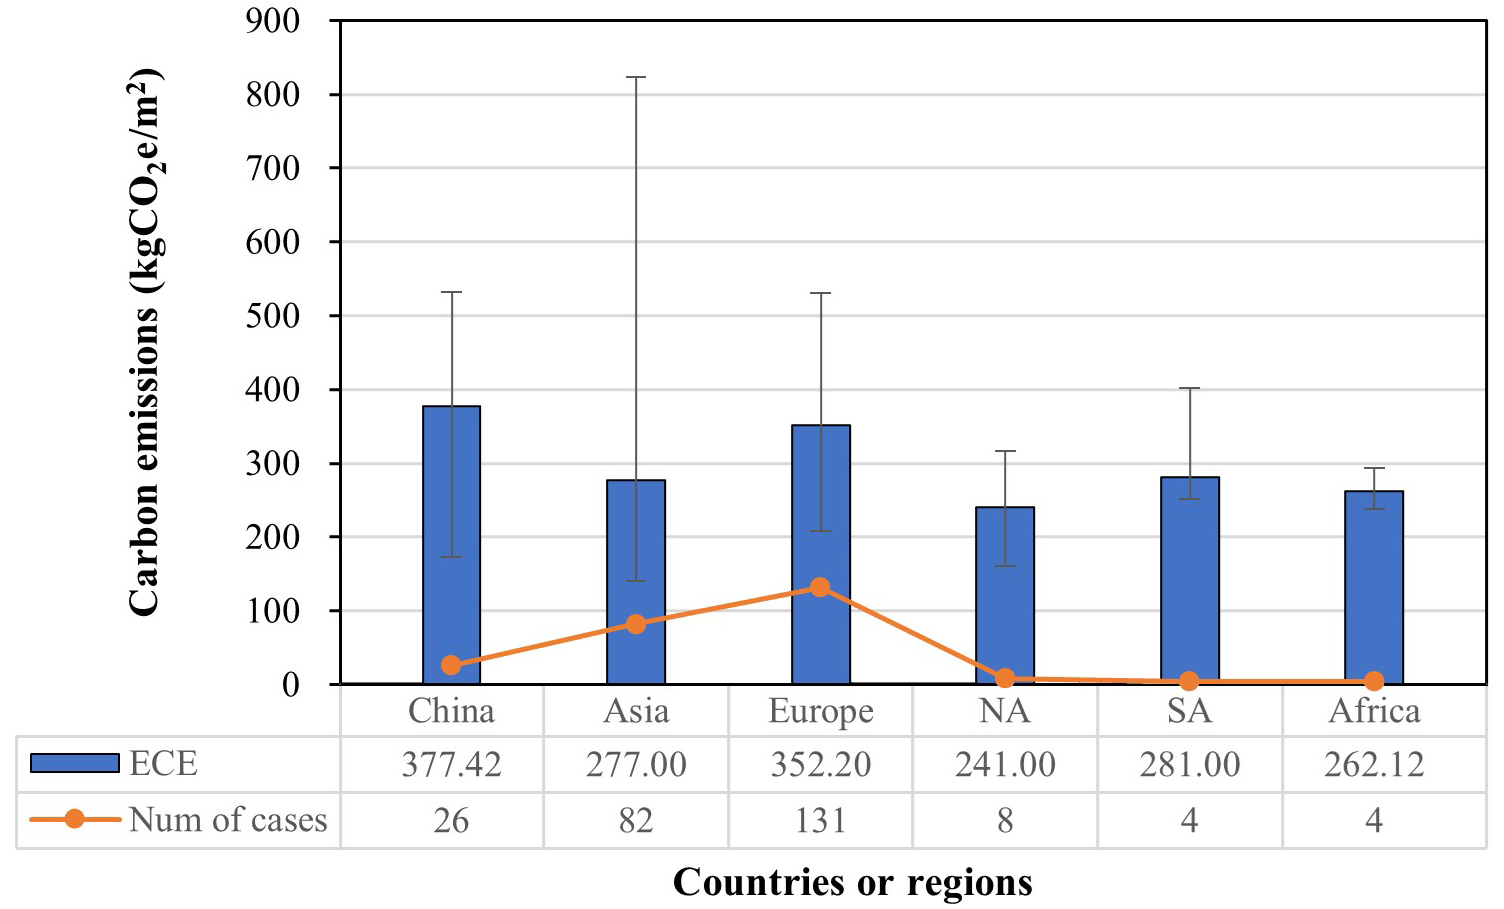
Figure 5. ECE calculation results by countries/regions. Data are presented as median (interquartile range, IQR). The top and bottom of the error bars represent the 75th (Q3) and 25th (Q1) percentiles, respectively. The sample sizes for China, Asia, Europe, NA, SA, and Africa were 26, 82, 131, 8, 4, and 4, respectively.





