



fig2
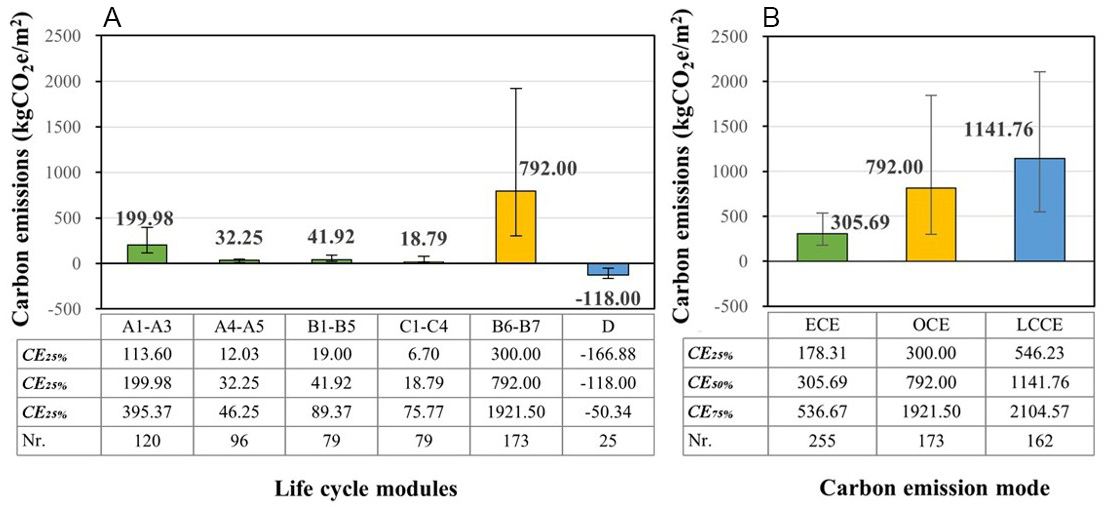
Figure 2. CE values per each life cycle stage within the analyzed case studies. (A) CE calculation results for each life cycle stage in the case studies; (B) ECE, OCE, and LCCE calculation results. Data are presented as median (interquartile range, IQR). The top and bottom of the error bars represent the 75th (Q3) and 25th (Q1) percentiles, respectively. The sample sizes for stages A1-A3, A4-A5, B1-B5, B6-B7, C1-C4, D, ECE, OCE, and LCCE were 120, 96, 79, 173, 79, 25, 255, 173, and 162, respectively.





