




fig3
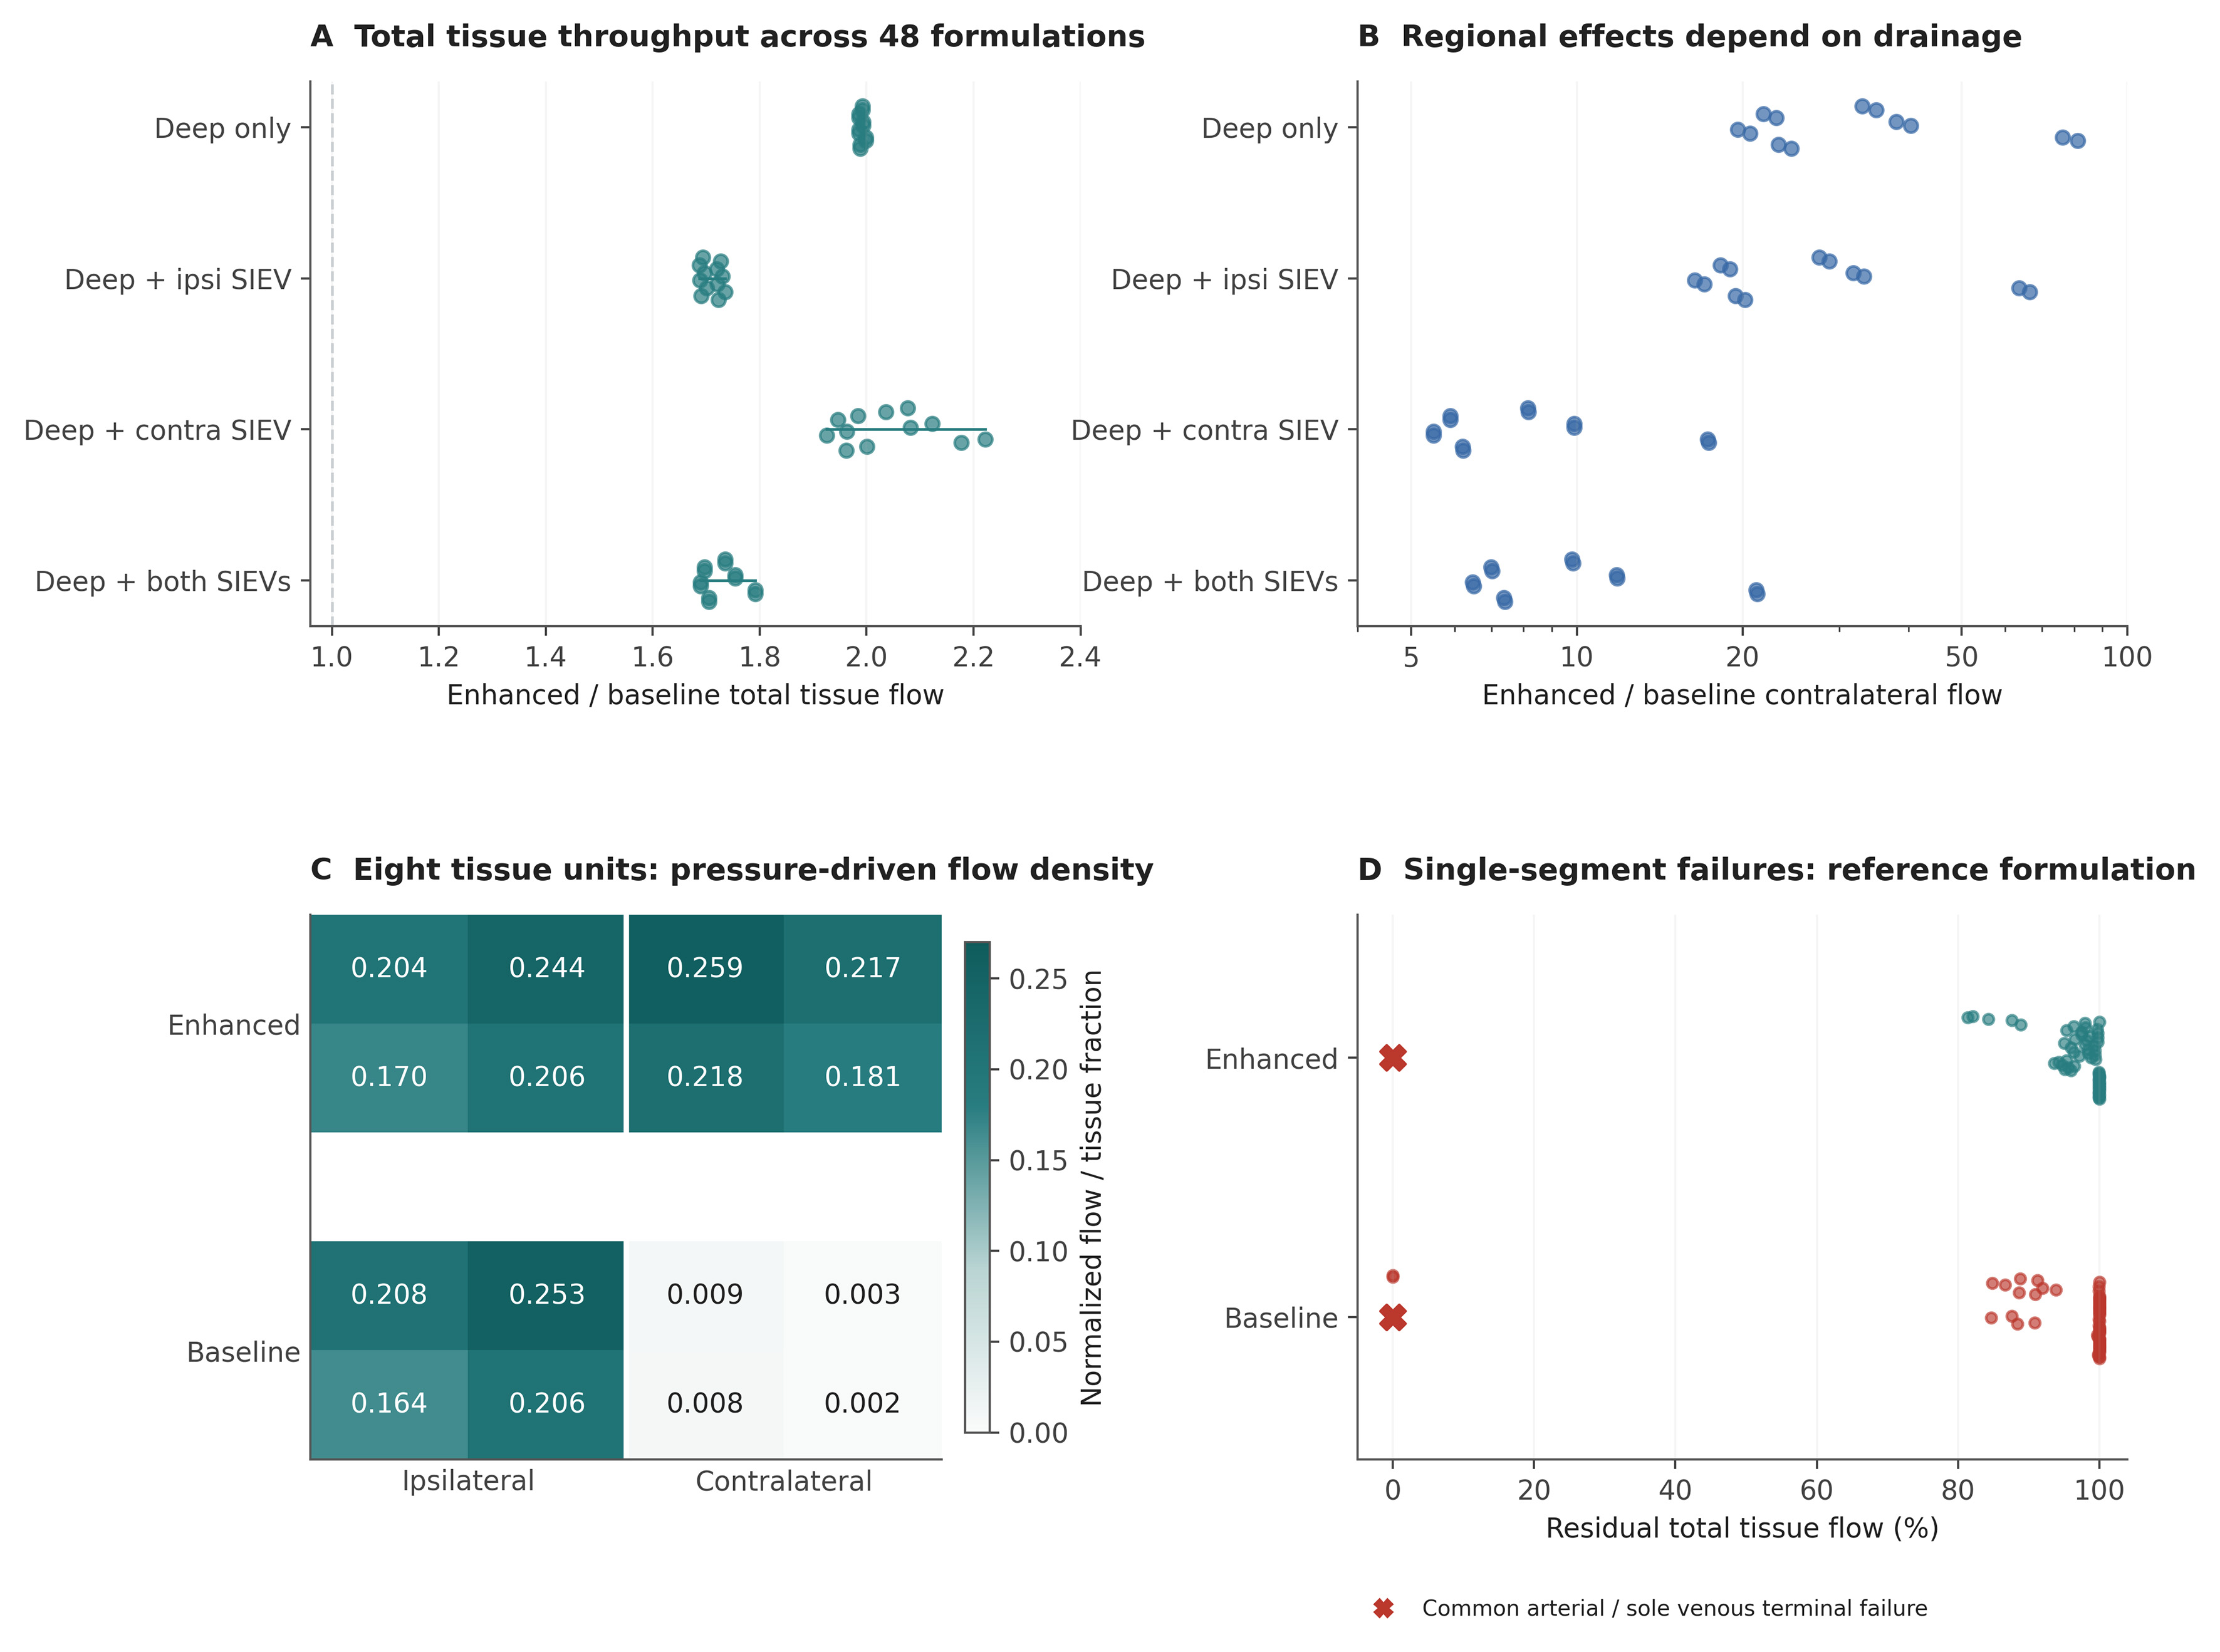
Figure 3. Pressure-driven tissue throughput and failure analysis. (A and B) Enhanced-to-baseline total and contralateral throughput ratios across 48 formulations, grouped by venous outlets. Each dot is a designed formulation, not a patient; offsets separate overlapping points. The contralateral ratio axis is logarithmic; (C) Flow density in each of the eight reference tissue units; density is unit flow divided by its tissue fraction 1/8. Both maps share the same color scale. The large regional ratios reflect very small baseline contralateral flow; (D) Residual total throughput after each single-segment deletion in the enhanced and baseline reference graphs. Colored dots show internal segments. Red crosses identify common arterial-pedicle and sole recipient venous-outlet failures at zero residual flow; these overlap at the plotted position. Preserved aggregate flow does not establish viability of every tissue region. SIEV: Superficial inferior epigastric vein.