




Network-theoretic modeling of DIEP flap perfusion redundancy for computational microsurgical planning
 0
Abstract
Aim: To determine which network descriptors of deep inferior epigastric perforator (DIEP) flap redundancy remain interpretable after separating arterial supply, tissue exchange and venous drainage, and after changing graph resolution.
Methods: We reproduced two nine-node archetypes and extended them to pressure-driven arterial-tissue-venous networks. Forty-eight formulations varied tissue subdivision, collateral distribution, superficial-to-deep connection location and venous outlets. Exact Shapley attribution evaluated 32 feature coalitions; additional contrasts tested conductance budgets. Conductance-preserving edge subdivision and Kron reduction tested representation dependence. Single-segment failures and exact enumeration of the original capacity networks characterized vulnerability.
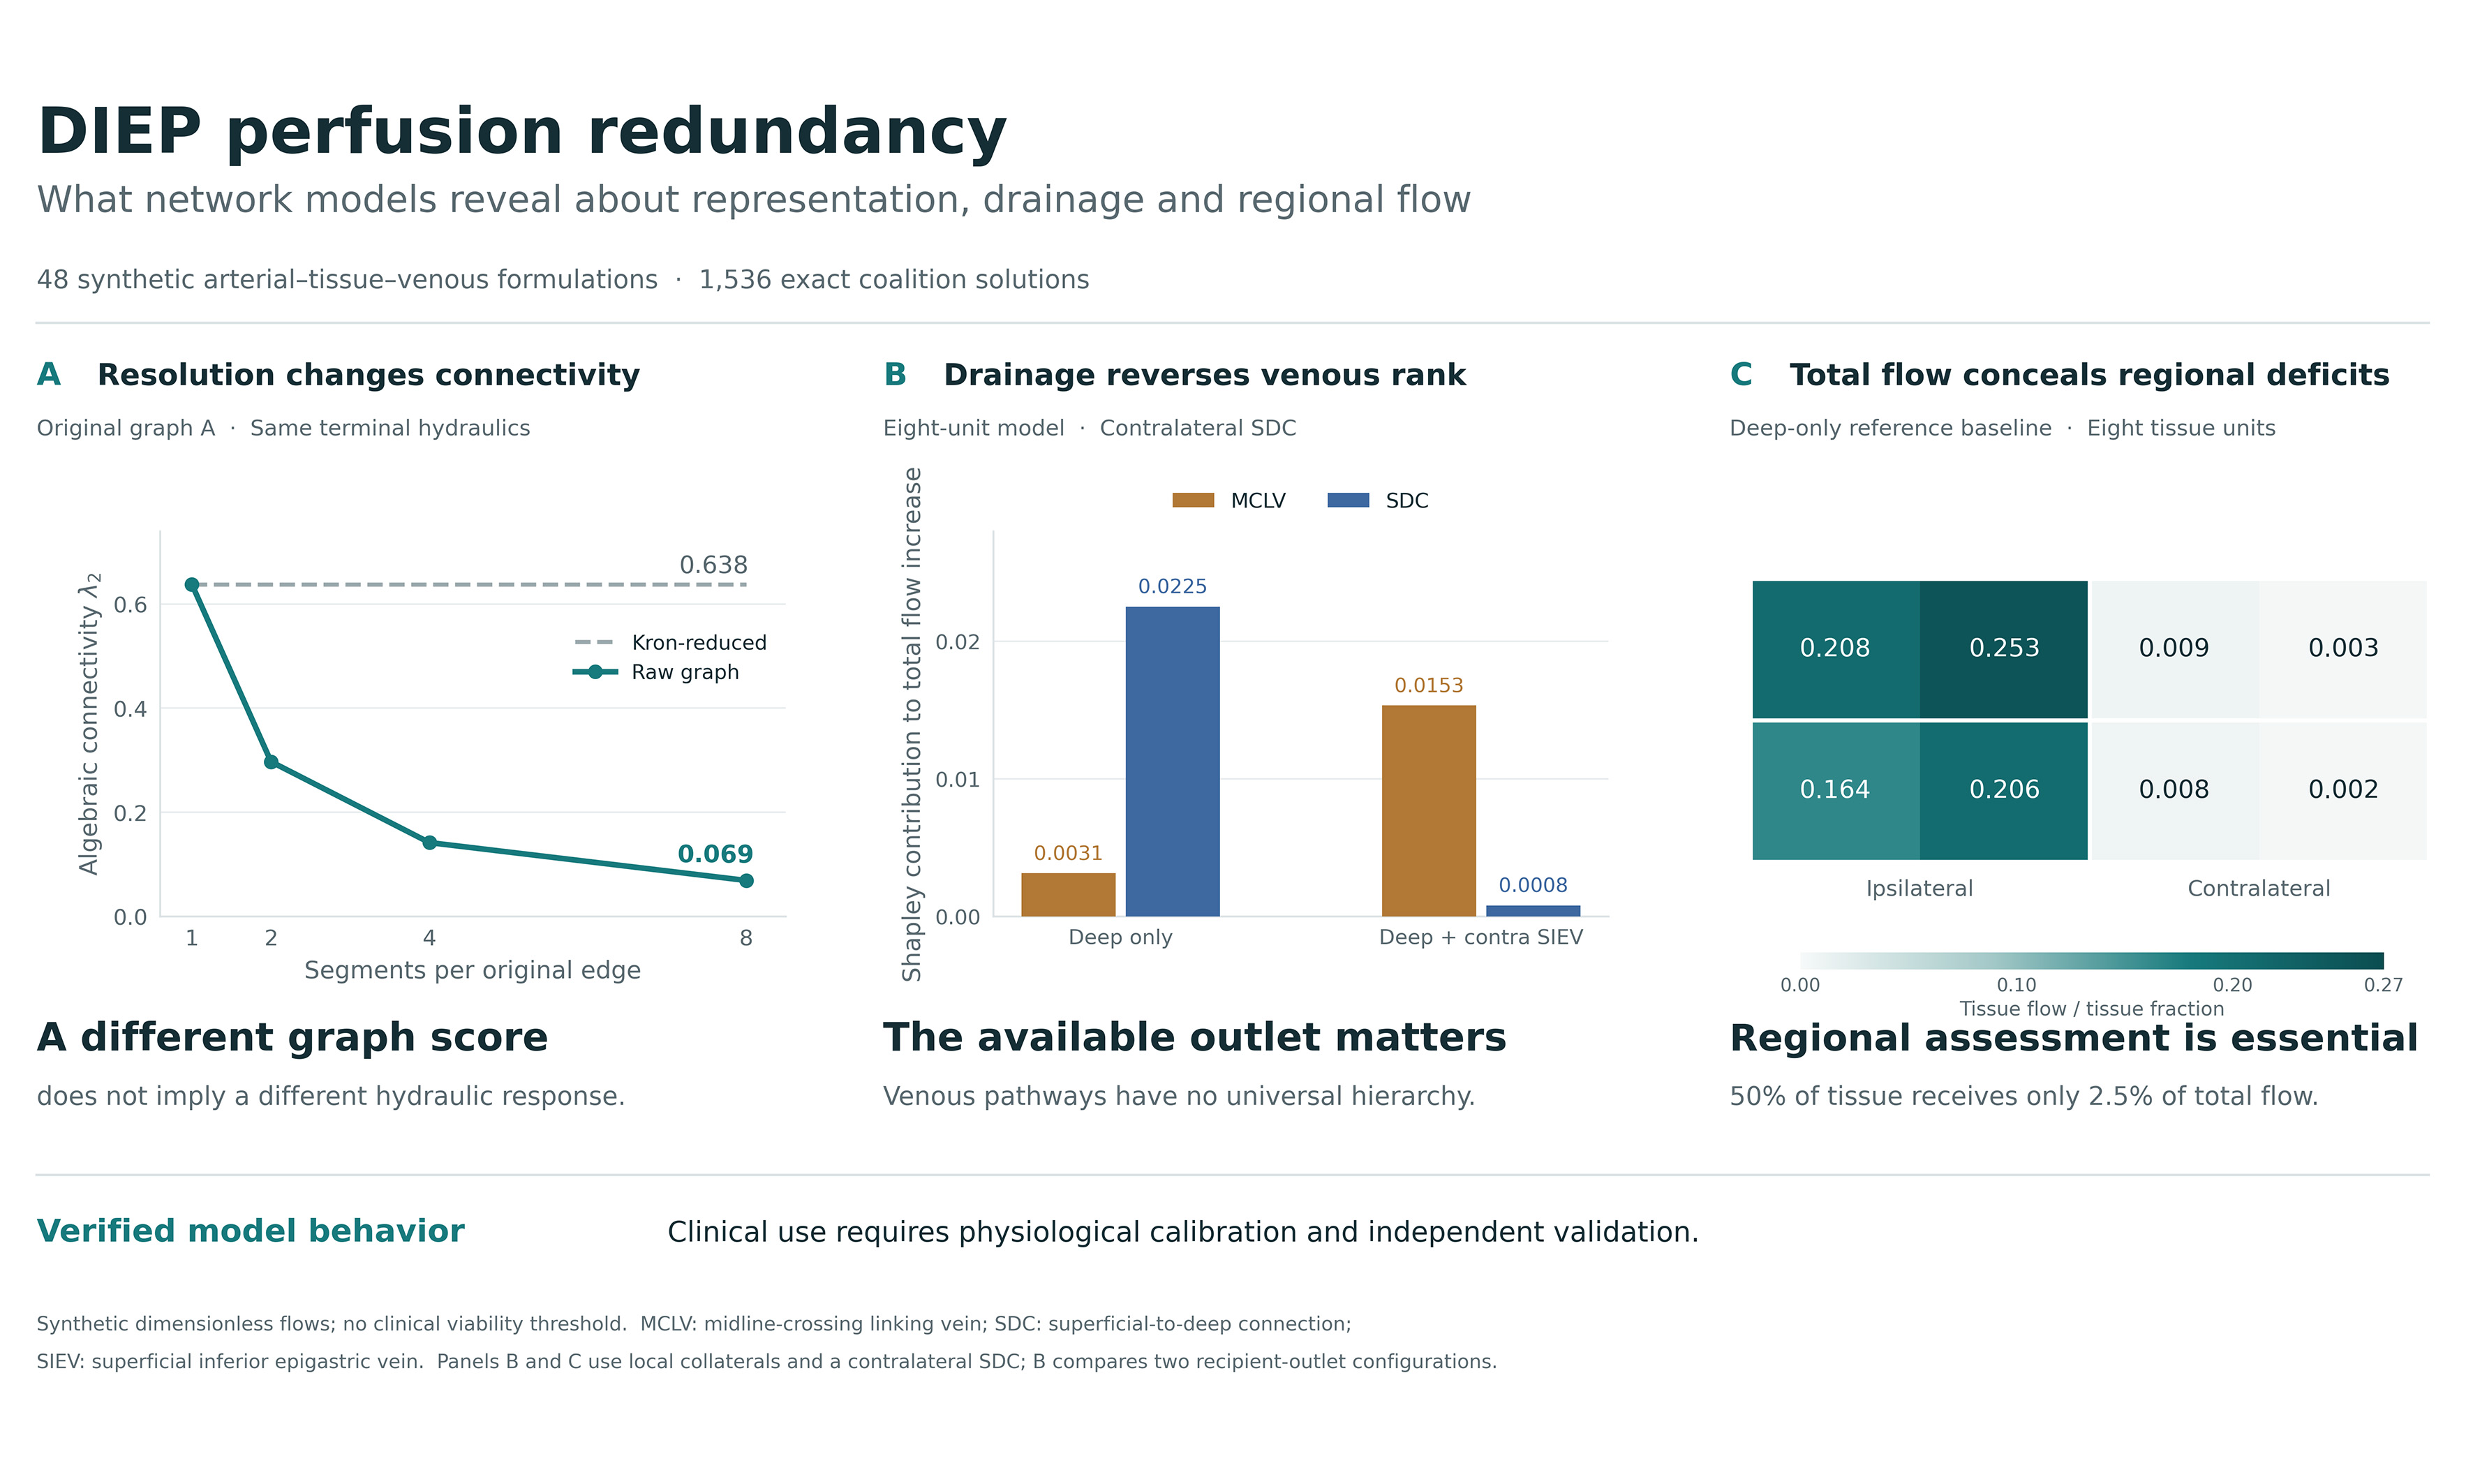
Results: Original algebraic connectivity was 0.638034 vs. 0.033342. Eightfold serial subdivision reduced the first value to 0.068918 without changing terminal hydraulic behavior; Kron reduction recovered the original value. Across the compartmental formulations, enhanced networks had 1.69-2.22 times the baseline total tissue throughput. The second perforator ranked first in all 48 reference-budget formulations and after equalizing feature budgets, but in 18/48 at one-tenth of its reference conductance. Venous rankings reversed with drainage. In the deep-only reference baseline, contralateral tissue received 2.5% of total throughput despite representing half the modeled tissue. Common arterial-pedicle or sole venous-outlet failure abolished flow despite internal collateral redundancy.
Conclusion: Network metrics describe a specified vascular representation. Their interpretation requires explicit drainage boundaries and regional tissue-flow assessment. This verified computational framework identifies assumptions that determine predicted redundancy; physiological calibration and independent validation are required before it can guide clinical DIEP planning.
Keywords
INTRODUCTION
Deep inferior epigastric perforator (DIEP) flap viability depends on the distribution of arterial supply and the availability of venous drainage across the transferred tissue. Recent clinical analyses relate perfused territory and perfusion-related complications to perforator caliber, position and flap geometry[1,2]. Direct and indirect linking pathways connect neighboring perforasomes[3], while choke-vessel behavior affects recruitment of adjacent territories[4]. Arterial and venous pathways also have different anatomical arrangements and physiological roles[5]. A useful computational representation must therefore distinguish the existence of a connection from its contribution to tissue blood flow.
Venous anatomy is particularly relevant. Sowa et al. associated the absence of contralateral superficial-to-deep connections (cSDC) and midline-crossing linking veins (MCLV) with fat necrosis and induration, especially in the distal contralateral territory[6]. A recent computed tomography angiography (CTA)-guided clinical series further emphasizes the relevance of superficial-deep venous communication to drainage planning[7]. The superficial inferior epigastric vein (SIEV) can provide an additional surgically established outlet when deep drainage is inadequate[8]. Indocyanine green studies have examined regional perfusion changes after additional superficial drainage in abdominally based flaps[9,10]. The presence of an SIEV within a flap, however, does not imply that it has been anastomosed to a recipient vein. Computational boundary conditions must preserve this distinction.
Quantitative indocyanine green angiography and comparisons with other perfusion-imaging modalities have advanced regional assessment of DIEP flaps[11,12]. Network analysis offers a complementary question: how does the arrangement of alternative routes affect tissue throughput and the consequences of a local failure? Algebraic connectivity summarizes a weighted graph’s connectivity[13], while resistive-network methods describe pressure-driven transport and permit physically consistent network reduction[14]. Plant hydraulic vulnerability curves provide an additional analogy for examining progressive loss of transport capacity[15]. The transfer concerns transport equations and node balance; each domain has distinct failure mechanisms.
This study develops a reproducible computational framework for evaluating DIEP vascular redundancy. We first reproduce the original nine-node abstraction, then test its interpretation using separate arterial and venous compartments, distributed tissue units, alternative venous outlets, continuous pathway conductances and a conductance-preserving resolution benchmark. The central objective is to establish which conclusions depend on the chosen representation and which remain consistent across explicitly defined model alternatives. The study provides a foundation for subsequent patient-specific validation.
METHODS
Study design and evidence basis
This computational verification study used synthetic graphs and published anatomical descriptions. It combined reproduction of a nine-node connectivity benchmark with pressure-driven compartmental models, a conductance-preserving resolution benchmark and exact capacity-degradation analysis. All analyses evaluated explicitly defined mathematical models; no patient-level data were used.
The anatomical literature informed pathway selection[1-12]. We used a narrative evidence assessment and targeted title and topic searches to verify relevant primary records. Supplementary Section 1 describes source-selection purposes and scope. Numerical conductances were defined as synthetic scenario parameters; published patient observations provided clinical context.
Original graph specification and interpretation
The original archetypes were retained as a reproducibility benchmark. Both contain nine fixed nodes: deep inferior epigastric artery (DIEA), P1, P2, Zone I, Zone II, Plexus, deep inferior epigastric vein (DIEV) and two SIEVs. Archetype A has 15 weighted undirected edges, and Archetype B has 12. The complete edge lists are provided in Supplementary Table 1 and the machine-readable supplement. Weights are dimensionless modeling choices. Although the relation g = πd4/(128 μL) motivates the influence of vessel caliber, no diameters, lengths or viscosities were measured to derive these values. The weight 0.03 defines a numerical low-conductance surrogate.
For an adjacency matrix W, the weighted Laplacian is L = D - W, and λ2 is its second-smallest eigenvalue[13]. This describes connectivity for a specified node set and weighting scheme. We also compared λ2 after normalizing each graph to unit summed edge weight. This controls the aggregate weight budget within these two fixed-node graphs but does not isolate unweighted topology from weight distribution. For the original N-1 analysis, each edge was deleted separately; a disconnection was counted as a graph-connectivity violation.
Compartmental arterial-tissue-venous model
The flow model separates arterial collectors, tissue exchange and venous collectors [Figure 1]. A common arterial source supplies the DIEA, which feeds the first perforator artery and, when recruited, a second perforator artery. Each tissue unit has an arterial node ai and venous node vi joined by one exchange conductance gci. Tissue venous nodes connect to ipsilateral or contralateral deep collectors and to the corresponding superficial collector. Deep collectors drain through the DIEV. MCLV connects the two superficial collectors; SDC connects one specified superficial collector to the deep venous collector. Arterial linking vessels remain in the arterial layer. There is no direct arterial-to-venous bypass that avoids tissue exchange.
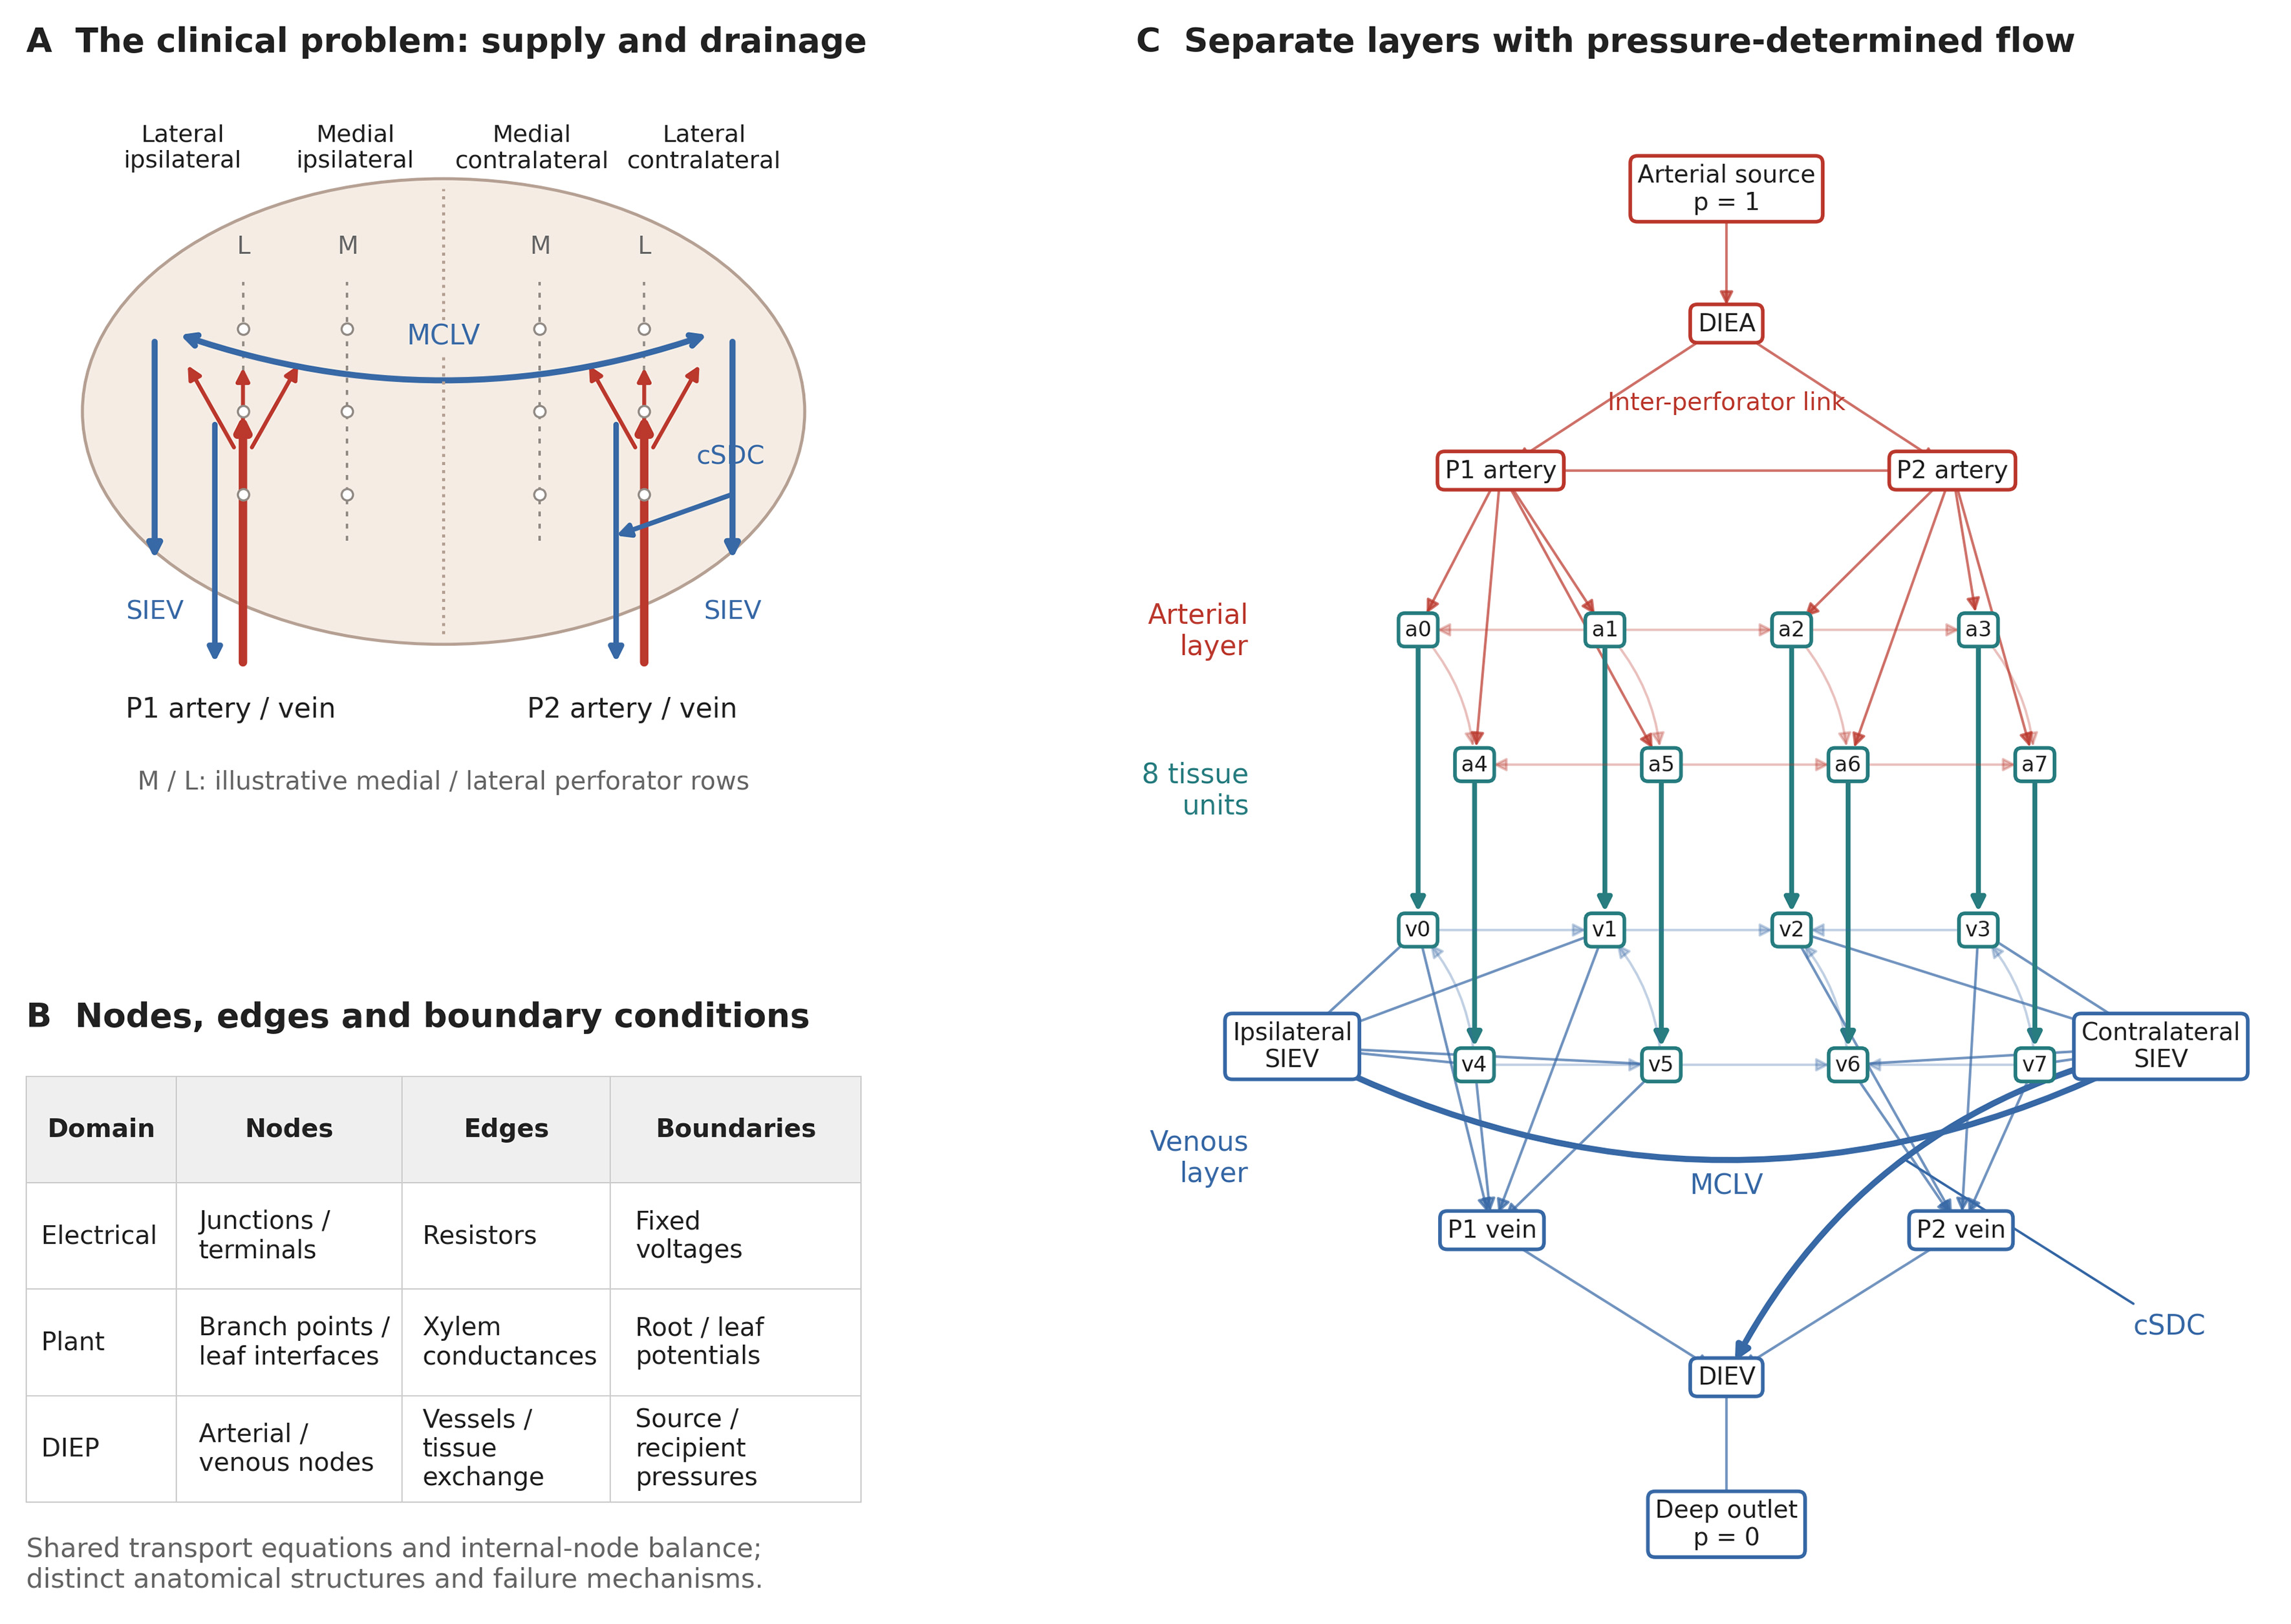
Figure 1. Clinical problem and compartmental model. (A) Idealized lower abdominal flap illustrating medial and lateral perforator rows, ipsilateral and contralateral tissue territories, perforator supply, superficial collectors, MCLV and cSDC. Territory labels indicate relative location, not a numbered perfusion-zone scheme or measured perforasomes; rows and pathway positions are schematic; (B) Mapping of nodes, edges and boundary conditions across resistive electrical networks, plant hydraulics and the DIEP model. Tissue units exchange flow and drain to veins; they are not terminal leaves; (C) Exact eight-unit enhanced reference graph (26 nodes, 61 edges). Red denotes arterial pathways, blue venous pathways and teal tissue exchange. Each ai/vi pair is one tissue unit. Arrows follow the solved pressure gradient; zero-flow connections are shown without arrows. Lighter lines indicate local collaterals. SIEVs are internal collectors in this deep-only configuration. The cSDC is contralateral. DIEV: Deep inferior epigastric vein; SIEV: superficial inferior epigastric vein; MCLV: midline-crossing linking vein; cSDC: contralateral superficial-to-deep connection; DIEP: deep inferior epigastric perforator.
Steady flow is determined by pressure, quv = guv(pu - pv), with conservation at every internal node. We fix the arterial source pressure at 1 and each active recipient venous outlet at 0, then solve Liipi = -Liβpβ. The pressures define a normalized driving difference. Edges are assigned a direction from higher to lower solved pressure; lateral arterial and venous connections can therefore reverse direction with the pressure field. The symmetric conductance operator implements a passive resistance law, producing signed, pressure-driven flows. All 1,536 intact coalition solutions had positive arterial-to-venous tissue exchange.
Tissue throughput is Q = Σiigci(pai - pvi). We report total Q, contralateral Q and the smallest tissue-unit flow per unit tissue fraction. Total Q also equals source inflow because every source-to-outlet route crosses tissue exchange. Flow values are dimensionless steady-state throughputs.
Structural alternatives and continuous pathways
The structural analysis crosses three tissue subdivisions (4, 8 or 16 units), two collateral patterns (local neighbor connections or distributed connections), two SDC locations (ipsilateral or contralateral), and four drainage configurations: deep only; deep plus ipsilateral SIEV; deep plus contralateral SIEV; and deep plus both SIEVs. This yields 48 formulations [see Supplementary Table 2]. SIEVs without an added recipient connection remain internal collectors with solved pressures. The reference formulation has eight tissue units, local collaterals, contralateral SDC and deep-only drainage.
The tissue units occupy a normalized rectangular layout with two rows. Perforator-to-tissue conductances are distributed by distance from illustrative perforator positions. Within each territory, branch weights are normalized to a fixed budget; total tissue exchange conductance is fixed at 1. Local and distributed collateral graphs also share the same total collateral budget. Thus, increasing tissue subdivision does not automatically multiply the aggregate exchange or collateral conductance. These alternatives test sensitivity to the representation of tissue and collateral pathways. All positions, budgets and construction rules are specified in Supplementary Section 2 and the executable code.
Five enhancement parameters range continuously from 0 to 1: second perforator recruitment, MCLV conductance, SDC conductance, plexus enhancement and arterial inter-perforator linking conductance. The baseline has all five parameters at 0, and the enhanced configuration has all five at 1. The baseline retains a positive collateral/plexus budget. All pathways coexist within the network. A 21 × 21 grid varies MCLV and SDC continuously under deep-only and additional contralateral SIEV drainage, with the other three parameters fixed at 1.
Exact feature attribution
For the original graphs, the value function v(S) is λ2 after applying a subset S of the five B-to-A edge changes. For each compartmental formulation, v(S) is total tissue throughput after setting the selected enhancement parameters to 1 and the others to 0. Contralateral throughput was analyzed separately. Exact Shapley values were computed from all 25 = 32 coalition values using φi = Σs |S|!(4 − |S|)!/5! × [v(S ∪ {i}) − v(S)], where S excludes i[16]. No sampling or random seed enters this calculation. Numerical efficiency was checked against v(all) - v(none) before rounding.
Shapley values allocate the change between two specified model states and incorporate interactions by averaging marginal contributions. They describe feature importance conditional on the chosen endpoints, budgets and network structure. Binary coalition endpoints are an attribution device for underlying continuous parameters. Feature definitions differ between the original and compartmental models and are documented separately.
Conductance-budget sensitivity
We evaluated dependence on the second-perforator budget across all 48 structural formulations by scaling both its arterial and venous pedicle conductances by 0.10, 0.25, 0.50, 1, 2 or 4. Other budgets and baseline states were held fixed. A separate control equalized the summed edge-conductance increment of each of the five enhancements to 0.40; the reference increments were 1.55, 0.45, 0.40, 1.20 and 0.30 for the second perforator, MCLV, SDC, plexus enhancement and linking vessel, respectively. Exact attribution was recomputed for all 32 coalitions in each contrast. These numerical stress tests examine budget dependence; equal summed conductance does not make the pathways physiologically equivalent.
Resolution, failure and uncertainty analyses
To test pure representation dependence, every original edge of conductance g was replaced by k serial edges of conductance kg, for k = 1, 2, 4 and 8. This preserves the original resistance because k/(kg) = 1/g. We computed raw λ2 and then eliminated added degree-two nodes by Kron reduction, Lr = Lββ - LβiLii-1Liβ, retaining the original nine nodes[14]. Recovery of the original reduced Laplacian tests implementation and invariance to this specified refinement. Complete subdivision and reduction results are reported in Supplementary Table 3.
Every segment of the reference compartmental baseline and enhanced networks was removed separately, pressures were recomputed, and residual tissue throughput was normalized to the corresponding intact network. Common arterial-pedicle and sole venous-outlet failures were retained and reported separately from internal-segment failures.
Maximum-flow degradation characterized the original capacity graphs, in which edge weights act as capacity bounds and paths can bypass the zone nodes. Its output is residual maximum-flow capacity, a diagnostic distinct from compartmental tissue throughput. We enumerated all 32,768 edge subsets of A and 4,096 of B, obtaining flow from the minimum over all 128 source-sink cuts[17]. Equal weighting of subsets at each number of failed edges gives the exact mean under uniform random-order deletion. The half-capacity crossing fraction f₅₀ is linearly interpolated between adjacent fractions bracketing 0.5: f50 = xj-1 + (yj-1 - 0.5)(xj - xj-1)/(yj-1 - yj). Dispersion is the population standard deviation across subsets at each step, not a confidence interval. The discrete residual-capacity means and standard deviations are provided in Supplementary Table 4.
Weight sensitivity used multiplicative lognormal factors exp(σZ), Z ~ N(0,1). For the original graphs, 2,000 independent draws per σ = 0.10, 0.20, 0.30 and 0.50 used separate seeds 4200-4203. For the reference compartmental pair, 1,000 draws at σ = 0.20 used seed 8400 and shared multipliers on corresponding segments to preserve a paired comparison. These factors are positive and unbounded; σ = 0.20 does not constrain changes to ±20%.
Computational verification
Analyses used Python 3.12.13, NumPy 2.3.5 and SciPy 1.17.0; the computational plots and graph drawings were generated with Matplotlib 3.10.8. Figure components were subsequently assembled and edited in Adobe Illustrator 2026 (version 30.1, the release line available in February 2026). Spectra were computed by symmetric eigendecomposition, and pressure systems by dense linear solution. Graph specifications, full-precision outputs and scripts accompany the submission. Deterministic calculations comprise the graph spectra, exact Shapley attribution, structural alternatives, pressure solutions, single-segment contingencies and enumerated degradation curves. Lognormal weight perturbations are the stochastic analyses. We report numerical ranges and simulation distributions without hypothesis tests or population inference. Source-tissue flow conservation, internal-node balance, Shapley efficiency and conductance-preserving reduction were checked numerically.
RESULTS
Reproduction of the original topology results
Archetype A had λ2 = 0.638034 and summed edge weight 8.15; B had λ2 = 0.033342 and summed edge weight 4.20. The unnormalized ratio was 19.14, and the ratio after equalizing the summed edge weights was 9.86 [Figure 2A and B]. Thus, within the original fixed-node representation, the difference was not explained by aggregate weight alone.
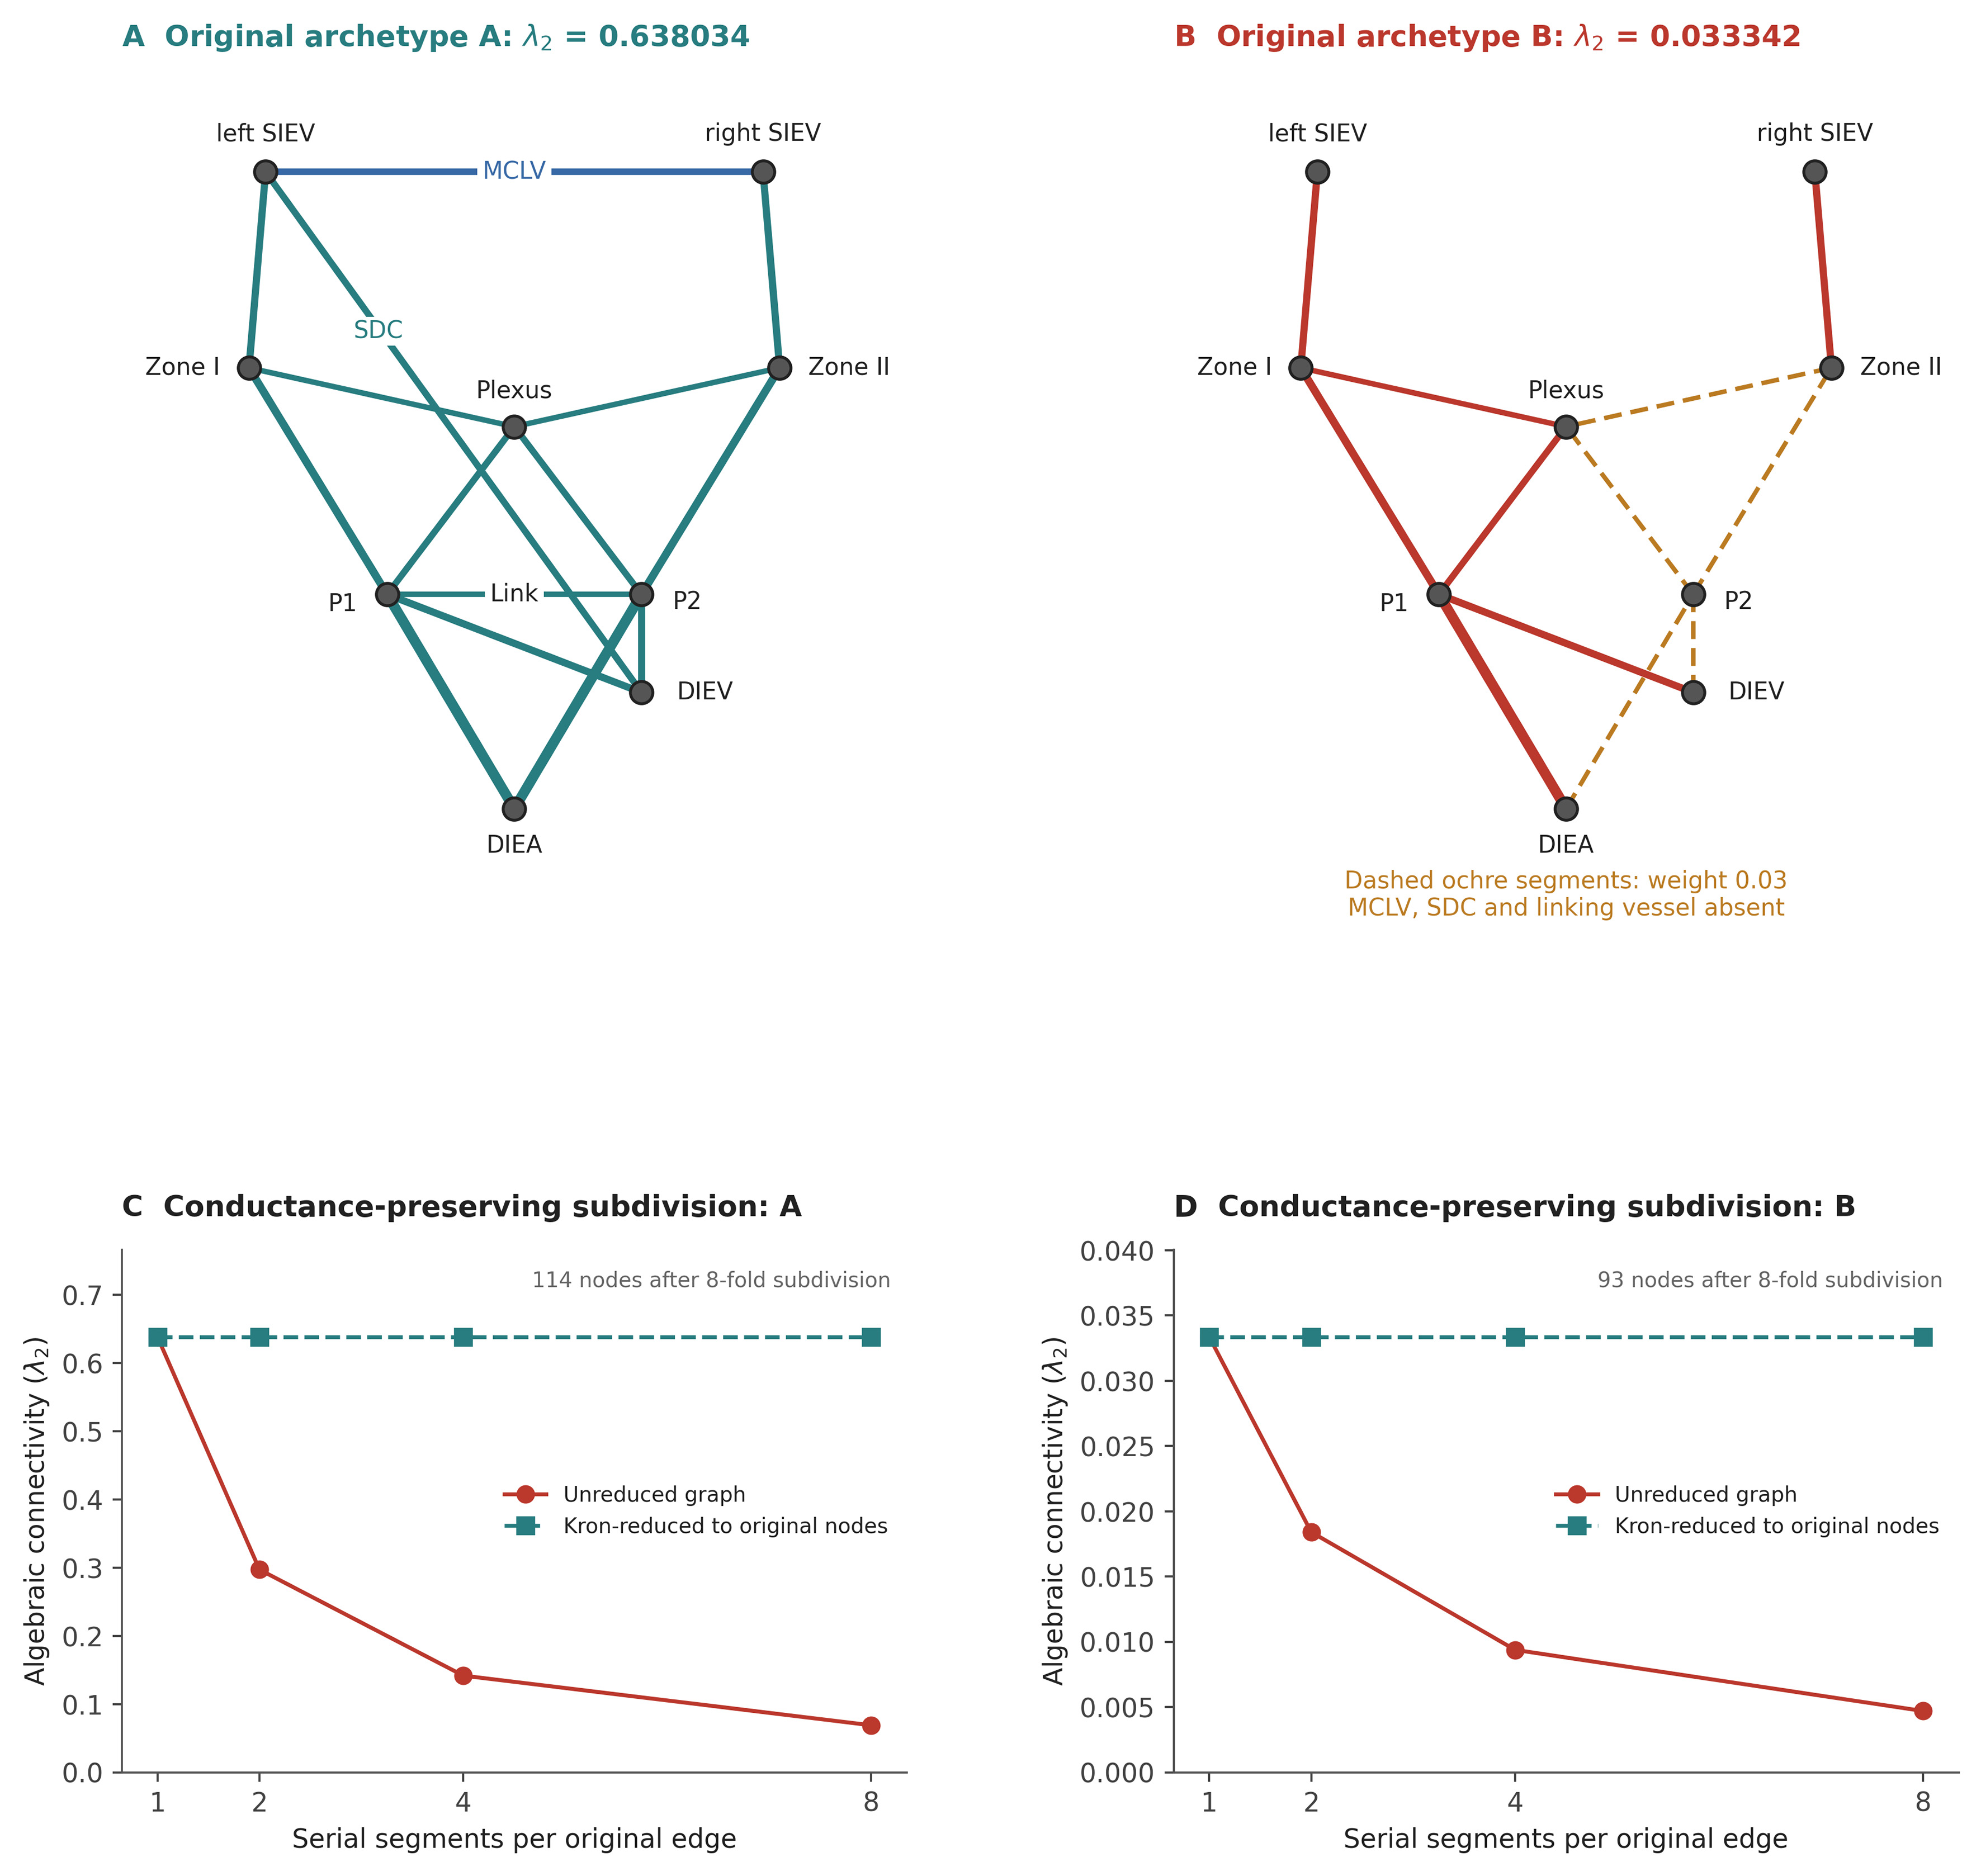
Figure 2. Original graph reproduction and representation dependence. (A and B) The exact original nine-node graphs with identical node positions. MCLV, the original ipsilateral SDC and the inter-perforator link are labeled in (A). In (B), thick ochre dashed edges denote the numerical weight 0.03; the three explicitly named linking edges are absent. These mixed graphs are retained as connectivity benchmarks, not hydraulic tissue models; (C and D) Replacing each edge g by k serial edges kg preserves its resistance while changing raw λ2. Kron reduction retaining the original nine nodes recovers the original connectivity value. This tests subdivision invariance, not the accuracy of anatomical coarse-graining. λ2: Second-smallest eigenvalue of the weighted Laplacian; SDC: superficial-to-deep connection; DIEA/DIEV: deep inferior epigastric artery/vein; SIEV: superficial inferior epigastric vein; MCLV: midline-crossing linking vein.
Exact Shapley attribution of the original connectivity gap gave: second perforator 0.252383, MCLV 0.185262, plexus bridge 0.076876, SDC 0.069389 and linking vessel 0.020782. Their full-precision sum was 0.604692178521, matching λ2(A) - λ2(B) [Table 1]. The original N-1 counts were 0 and 2. Both B violations isolated a superficial-vein node.
Exact attribution of the original between-archetype connectivity difference
| Original graph feature | Shapley value φ | Share (%) |
| Second perforator | 0.252383 | 41.7 |
| MCLV | 0.185262 | 30.6 |
| Subdermal-plexus bridge | 0.076876 | 12.7 |
| SDC | 0.069389 | 11.5 |
| Inter-perforator linking vessel | 0.020782 | 3.4 |
| Total | 0.604692 | 100.0 |
Graph resolution changes raw connectivity without changing terminal behavior
At eightfold serial subdivision, A contained 114 nodes and raw λ2 fell from 0.638034 to 0.068918. B contained 93 nodes and λ2 fell from 0.033342 to 0.004696. The underlying terminal resistances were unchanged. Kron reduction recovered the original nine-node Laplacians with a maximum absolute matrix-entry discrepancy of 3.6 × 10⁻¹⁵ [Figure 2C and D, Supplementary Table 3]. Consequently, raw λ2 cannot be compared across arbitrary vessel segmentations as if it were a segmentation-invariant perfusion measurement.
Tissue throughput and local failure resilience
Across all 48 compartmental formulations, enhanced total tissue throughput exceeded baseline throughput by factors of 1.69-2.22 [Figure 3A and Supplementary Table 2]. The direction of this change is expected for a passive network with increased conductances and fixed pressures; the informative findings are its magnitude, spatial distribution and dependence on drainage boundaries. The reference-enhanced and baseline throughputs were 0.212518 and 0.106603, respectively, a ratio of 1.99. Contralateral throughputs were 0.109442 and 0.002708 [Table 2]. The large regional ratio reflects a near-stagnant synthetic baseline.
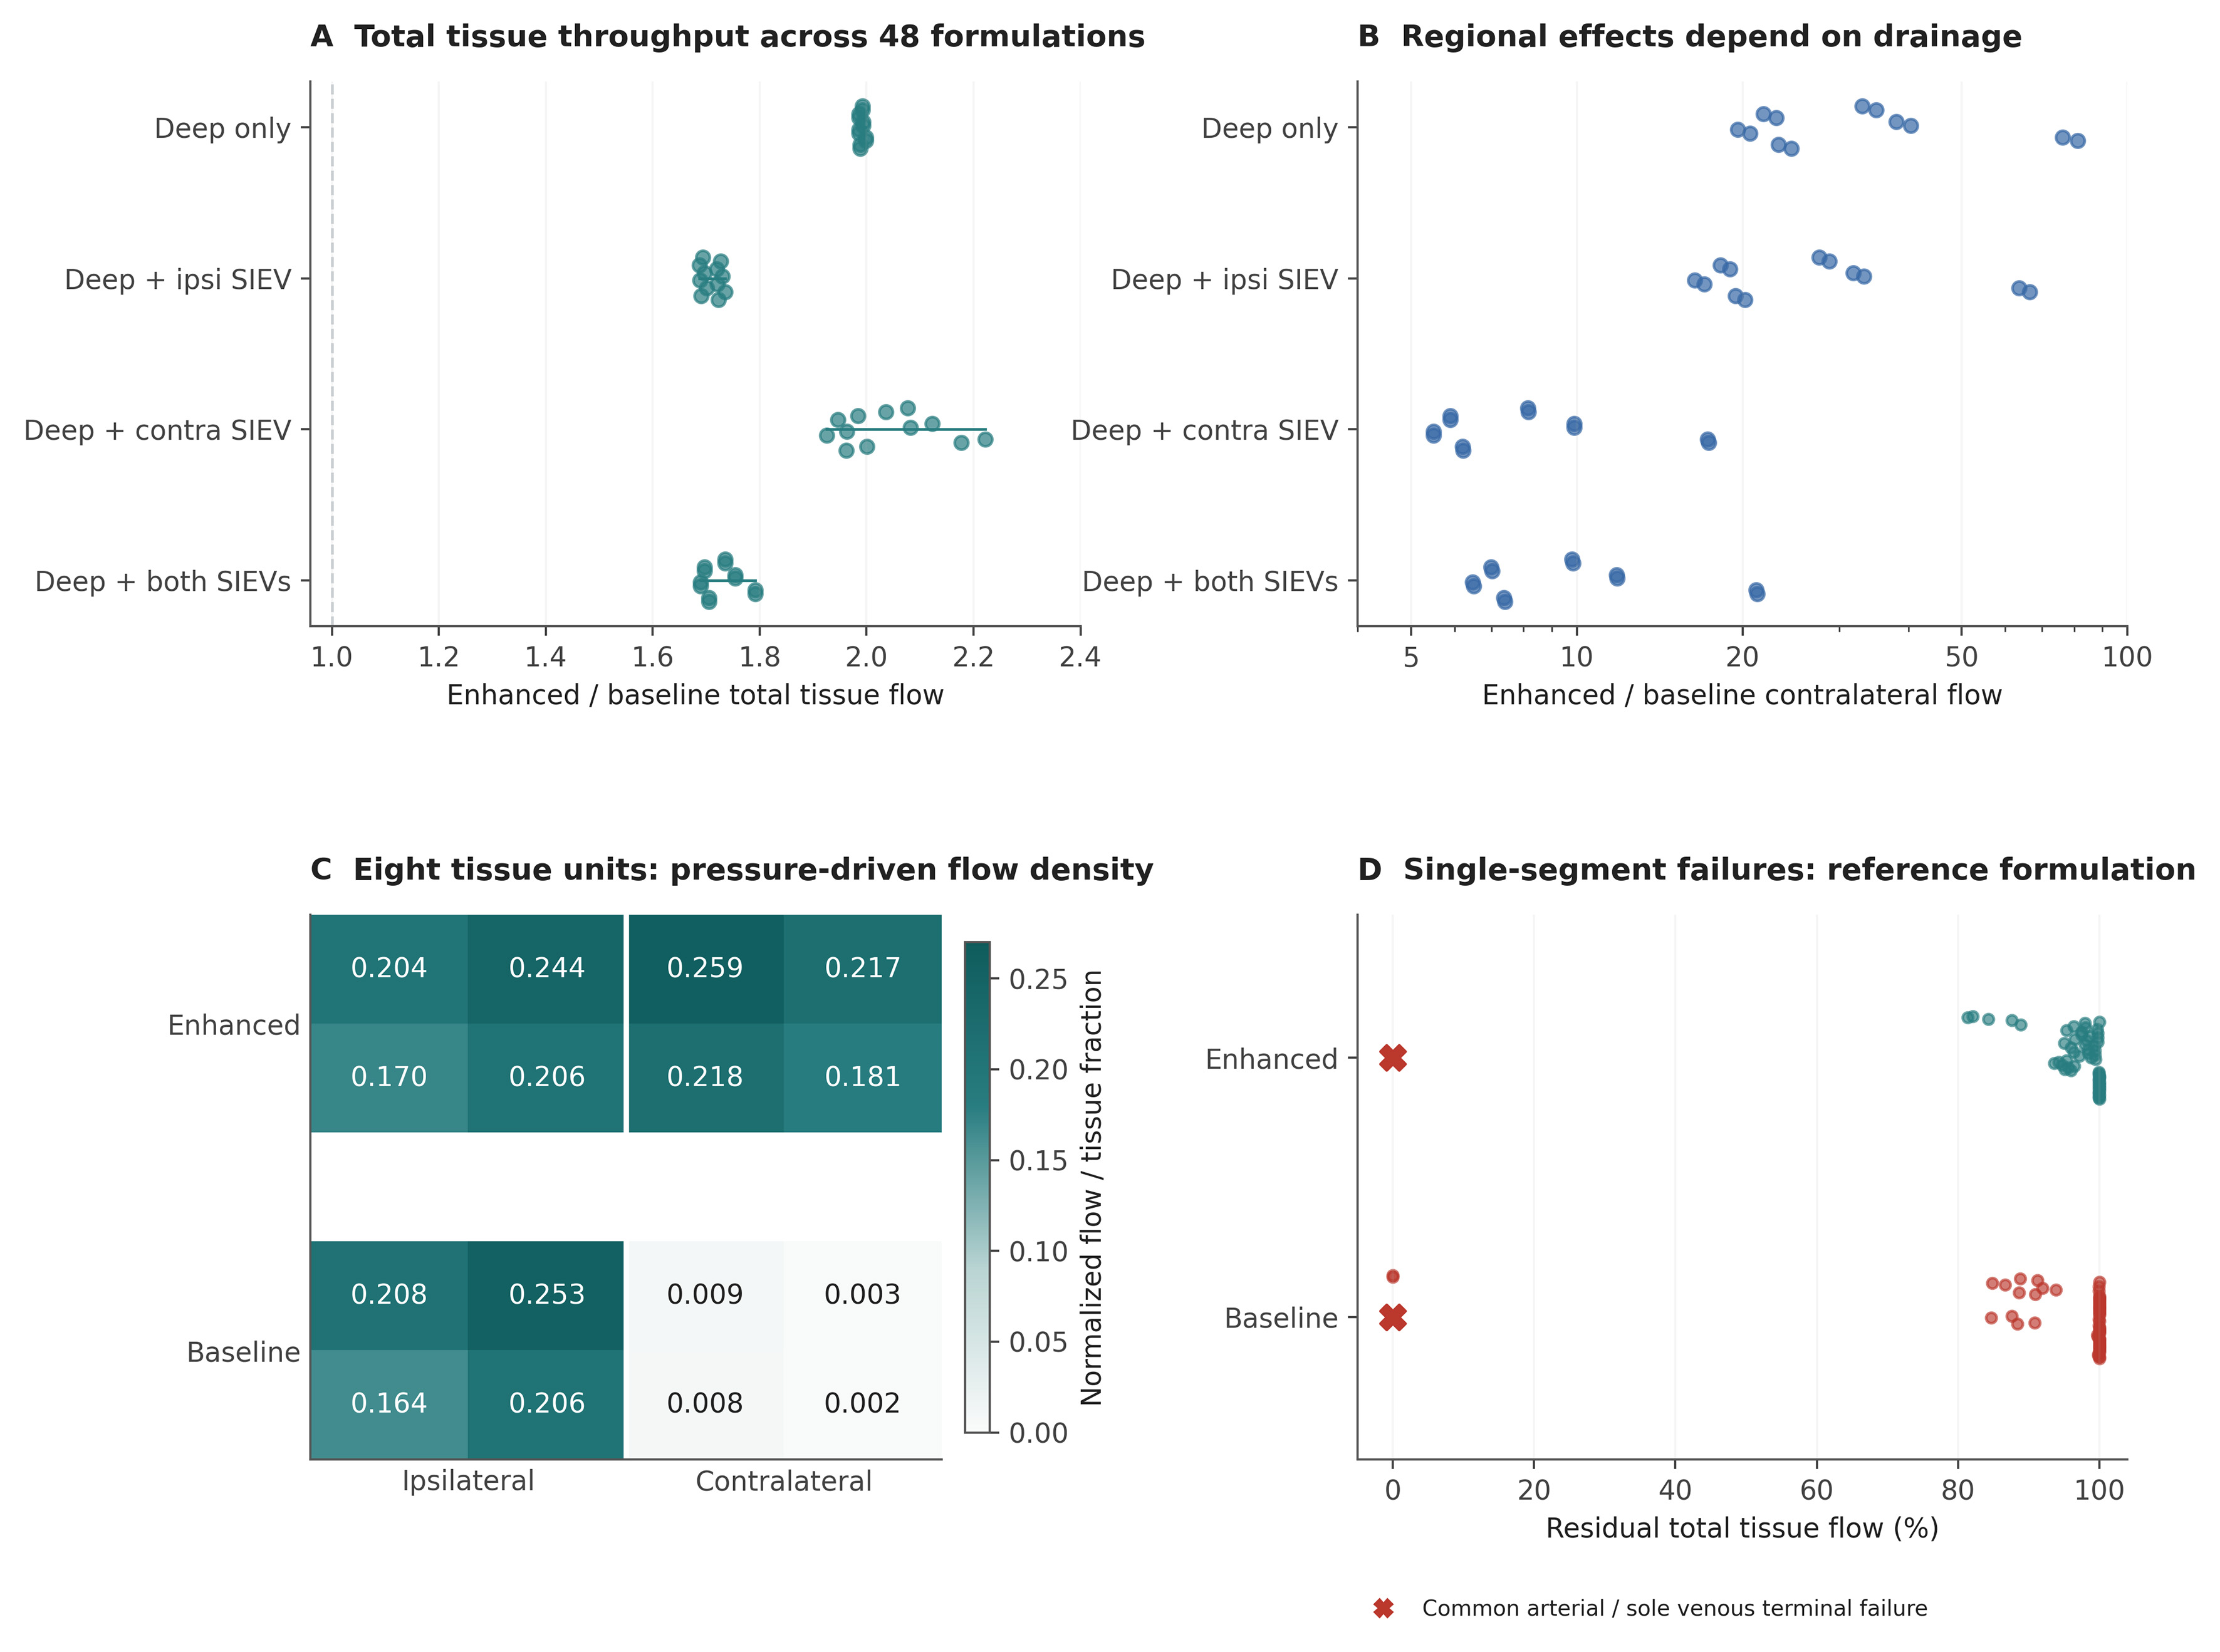
Figure 3. Pressure-driven tissue throughput and failure analysis. (A and B) Enhanced-to-baseline total and contralateral throughput ratios across 48 formulations, grouped by venous outlets. Each dot is a designed formulation, not a patient; offsets separate overlapping points. The contralateral ratio axis is logarithmic; (C) Flow density in each of the eight reference tissue units; density is unit flow divided by its tissue fraction 1/8. Both maps share the same color scale. The large regional ratios reflect very small baseline contralateral flow; (D) Residual total throughput after each single-segment deletion in the enhanced and baseline reference graphs. Colored dots show internal segments. Red crosses identify common arterial-pedicle and sole recipient venous-outlet failures at zero residual flow; these overlap at the plotted position. Preserved aggregate flow does not establish viability of every tissue region. SIEV: Superficial inferior epigastric vein.
Tissue throughput in the eight-unit local compartmental model by venous outlet configuration
| Recipient outlets | Total Qbaseline | Total Qenhanced | Contra Qbaseline | Contra Qenhanced |
| Deep only | 0.106603 | 0.212518 | 0.002708 | 0.109442 |
| Deep + ipsilateral SIEV | 0.145589 | 0.251917 | 0.003698 | 0.122732 |
| Deep + contralateral SIEV | 0.118646 | 0.246977 | 0.013074 | 0.129455 |
| Deep + both SIEVs | 0.151971 | 0.266585 | 0.011274 | 0.133566 |
Changing the venous outlets altered both total and regional responses [Figure 3A-C]. Across formulations, contralateral enhanced-to-baseline flow ratios ranged from 5.49 to 81.16. The minimum reference tissue-unit flow density increased from 0.002265 to 0.170025. In the deep-only reference baseline, the contralateral half of the modeled tissue received only 2.5% of total throughput (0.002708/0.106603). These observations show why whole-network throughput cannot substitute for inspection of individual tissue territories.
Single-segment deletion evaluated 61 edges in the enhanced reference network and 56 in the baseline network [Figure 3D]. Every internal-segment failure in the enhanced configuration retained at least 81.4% of intact total throughput. In the baseline, interruption of the sole functional perforator’s arterial or deep venous pedicle connection abolished flow. Both configurations lost all throughput after common arterial-pedicle failure or loss of the sole recipient venous outlet. Therefore, internal collateral redundancy does not confer whole-flap N-1 security.
Venous feature importance depends on the drainage configuration
At the reference budgets, the second perforator was the largest Shapley contributor to total throughput in all 48 formulations. The MCLV exceeded the SDC contribution in only 15; SDC exceeded MCLV in the remaining 33 [Figure 4A and B]. Under reference deep-only drainage, the SDC contribution was 0.022517 compared with 0.003140 for MCLV. With an additional contralateral SIEV outlet, the corresponding contributions became 0.000797 and 0.015334. The original mixed-graph hierarchy therefore does not support a universal ranking of these two venous pathways.
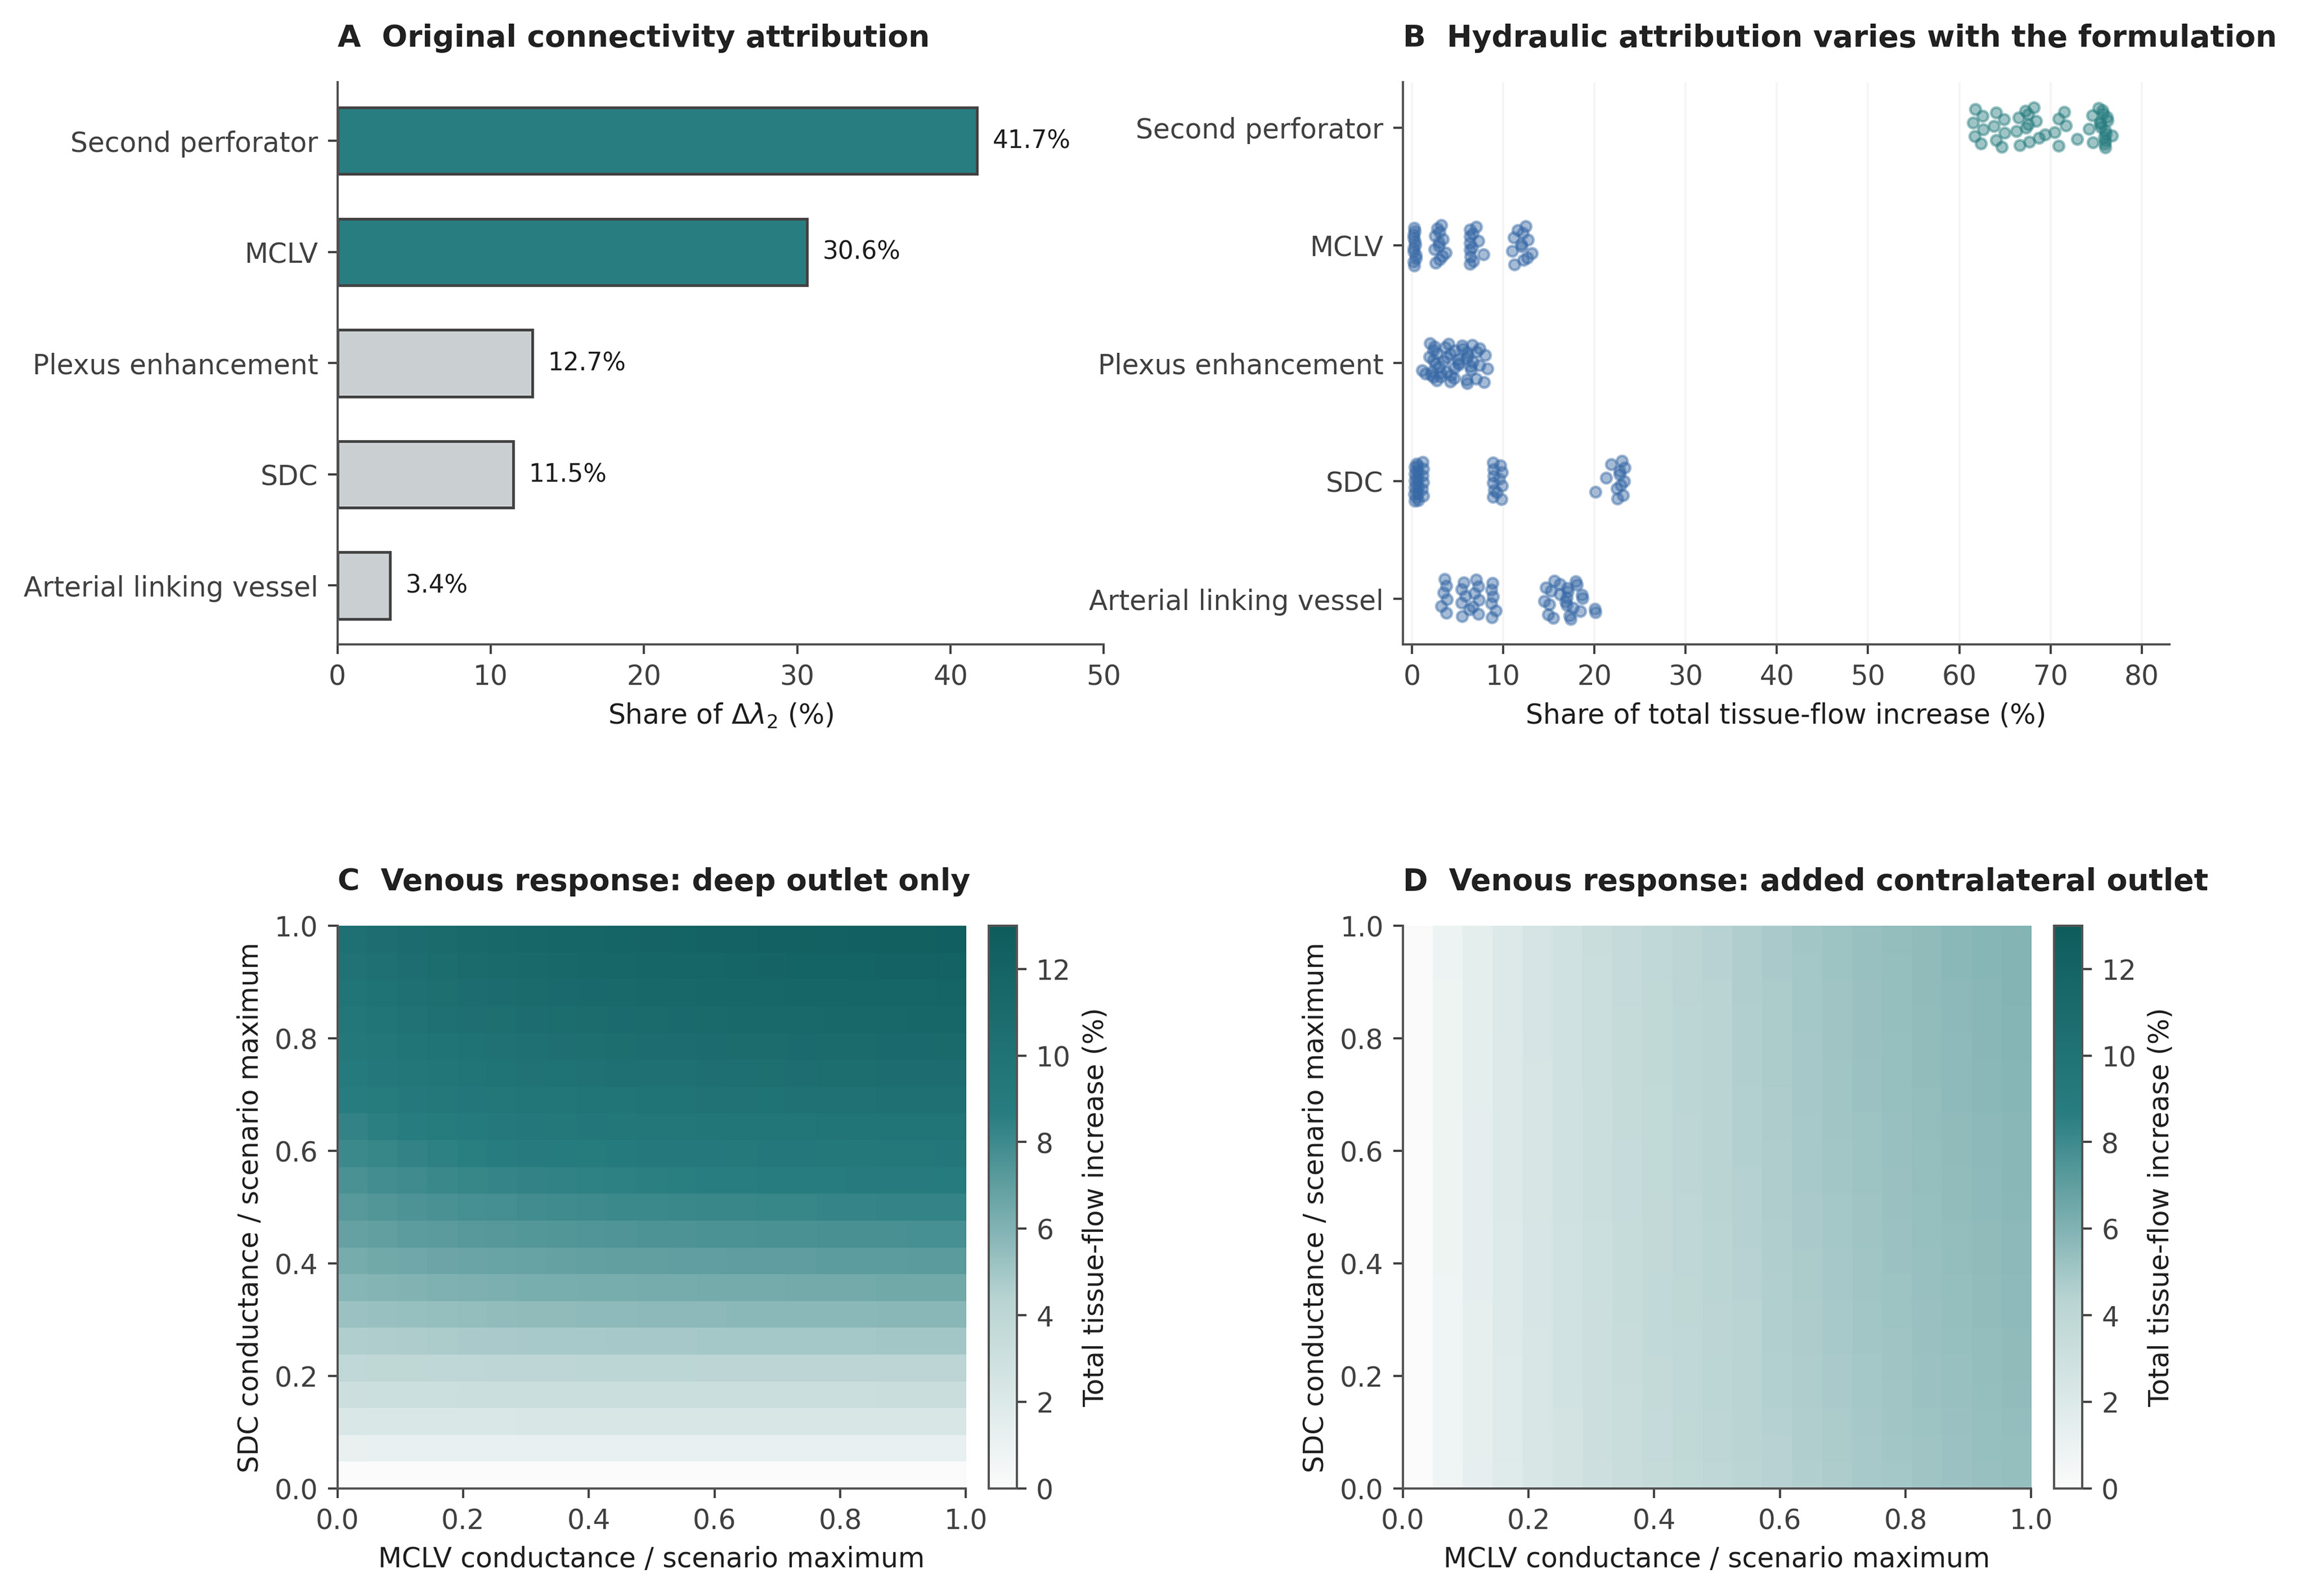
Figure 4. Conditional feature attribution and continuous venous responses. (A) Exact Shapley allocation of the original λ2 gap; (B) Exact total-throughput Shapley shares across 48 compartmental formulations. Original and compartmental feature definitions differ and are specified in Methods; percentages are allocations within each model, not physiological effect sizes; (C and D) Continuous MCLV-SDC conductance grids for the eight-unit local model with cSDC and either deep-only drainage or an additional contralateral SIEV outlet. Other enhancement parameters are fixed at 1. Colors show total-throughput increase relative to MCLV = SDC = 0 within each outlet configuration. Under deep-only drainage with SDC = 0, superficial collector pressures are equal and MCLV carries no flow. Increasing SDC breaks this symmetry, allowing an additional MCLV contribution. The added contralateral outlet also changes collector pressures and the MCLV response. (B) uses the reference budgets; Supplementary Table 5 reports the budget controls. MCLV: Midline-crossing linking vein; SDC: superficial-to-deep connection; SIEV: superficial inferior epigastric vein.
The continuous response surfaces resolved the dependence of each venous pathway on the other pathway and the recipient outlets [Figure 4C and D]. With the other enhancements fully recruited and deep-only drainage, adding MCLV alone did not increase total throughput in the symmetric endpoint network; adding SDC increased throughput from 0.188954 to 0.208260, and adding both increased it to 0.212518. With an additional contralateral SIEV outlet, MCLV alone increased throughput from 0.233148 to 0.245720. Regional attribution can also be negative when a connection redistributes flow between territories, despite a positive contribution to total throughput; complete regional values are supplied with the code.
Feature rankings under alternative conductance budgets
The second perforator remained the largest contributor in all 48 formulations at all tested multipliers from 0.25 to 4 and in the equal-increment control. At a multiplier of 0.10, it ranked first in 18 formulations; the arterial linking vessel ranked first in 18 and SDC in 12 [Supplementary Table 5]. Thus, its reference ranking persisted after equalizing aggregate enhancement budgets but changed under marked attenuation of the direct perforator pathway. The seven contrasts comprised 336 formulation-budget combinations and 10,752 coalition solutions, including the reference-budget replication.
Exact degradation, weight sensitivity and numerical checks
Exact enumeration gave f50 = 32.24% for original archetype A and 28.75% for B [Supplementary Figure 1 and Supplementary Table 4]. B had greater degradation dispersion over the early and middle deletion fractions. For example, after removal of one-third of the edges, its residual-capacity standard deviation was 0.465, compared with 0.249 in A.
Original λ2(A) exceeded λ2(B) in all 2,000 perturbation draws at every tested σ. At σ = 0.20, A’s median was 0.629517 (interquartile range 0.597702-0.662615), vs. 0.033550 for B. In the paired compartmental perturbation analysis, the median total-throughput ratio was 2.00, with simulation 2.5th-97.5th percentiles of 1.84-2.21 [Supplementary Figure 2]. These distributions characterize the specified weight perturbations. The largest internal-node conservation residual across the 1,536 structural coalition solutions was 1.33 × 10⁻¹⁵; all intact tissue exchange flows were positive. Across the additional budget contrasts, the maximum conservation residual was 2.66 × 10⁻¹⁵ and the maximum Shapley-efficiency error was 5.55 × 10⁻¹⁷.
DISCUSSION
The compartmental and subdivision analyses show that several apparently intuitive conclusions about DIEP vascular redundancy depend on how the flap is represented. Raw λ2 changed despite preserved terminal hydraulics; the relative contributions of MCLV and SDC reversed with the available venous outlets; and appreciable total tissue throughput coexisted with marked contralateral underperfusion. These findings identify the assumptions that determine a network-based perfusion estimate. They establish the behavior of the computational framework, while its physiological accuracy remains to be tested against measurements in human DIEP flaps.
Connectivity requires a defined anatomical representation
Algebraic connectivity is a property of a specified weighted graph, not an intrinsic physiological property of a flap. Its value depends on which anatomical structures become nodes and edges, how vessels are segmented and weighted, and which boundary vessels are included. In the subdivision benchmark, raw λ2 in archetype A fell from 0.638034 to 0.068918 although resistance between the original nodes was preserved. A lower value after subdivision therefore cannot be interpreted as reduced collateral reserve or deteriorating perfusion. Two graphs of the same vascular tree may yield different values solely because their segmentation rules differ.
Kron reduction recovered the original metric because the same nine nodes were retained and the inserted segments were hydraulically equivalent[14]. This is an internal equivalence check; it does not establish a uniquely correct anatomical representation or validate the chosen conductances. For imaging-derived comparisons, node definitions, vessel weighting and the treatment of segmentation nodes must be standardized, and the represented inflow and drainage boundaries must be stated. Spectral descriptors can then be compared within that convention and assessed alongside pressure-driven tissue outputs.
The residual 9.86-fold separation after equalizing summed weights remains a valid result within the original node set. Its proper interpretation is sensitivity to the combined arrangement and distribution of connections, not a 9.86-fold physiological resilience advantage. Similarly, the original absence of graph bridges in A cannot establish tolerance of arterial anastomosis or recipient-vein failure when those shared terminal segments were not represented separately.
Drainage boundaries determine the role of a venous connection
The reversal of the MCLV-SDC hierarchy shows why venous structures cannot be assigned a universal order of importance. An MCLV links superficial collectors across the midline, whereas an SDC connects a superficial collector to the deep drainage route. Each pathway contributes only through the pressure differences and downstream routes available to it. Under reference deep-only drainage, SDC contributed more to total throughput than MCLV; adding a contralateral SIEV outlet reversed that relationship [Figure 4]. In the symmetric deep-only endpoint without SDC, MCLV carried no flow because the superficial collectors had equal pressures. Its presence alone did not create effective drainage.
For surgical interpretation, the relevant question is whether a venous connection gives the tissue access to a functioning recipient outlet. A superficial vein retained within the flap is an internal collector until an additional anastomosis establishes an outlet. This distinction is consistent with anatomical variation in venous communication[5-7] and the use of SIEV drainage in selected reconstructions[8-10]. Our results explain how the benefit of a linking vein can change with the planned drainage arrangement; they do not establish that MCLV preservation or SDC recruitment is invariably the preferable maneuver. The 15/48 rank count describes the designed scenario set, not the prevalence of a venous pattern or the probability of benefit in patients.
The same conditional logic applies to the second perforator. Its reference enhancement adds both arterial supply and deep venous drainage with a summed conductance increment of 1.55, compared with 0.45 for MCLV and 0.40 for SDC. Equalizing all five feature increments to 0.40 preserved its leading contribution across the tested formulations, showing that aggregate budget alone does not explain that ranking. Reducing its pedicle conductances to one-tenth of the reference values changed the leading feature in 30/48 formulations. Together, these controls identify a role for both pathway placement and conductance magnitude; the ranking remains conditional on the selected model family.
Spatial flow and local redundancy
Total tissue throughput is the sum of regional flows, so a well-supplied territory can mask very low flow elsewhere. In the reference baseline, half of the modeled tissue was contralateral, yet this half received only 2.5% of total throughput. The model therefore retained substantial overall transport while distributing it very unevenly [Figure 3C]. This is especially relevant to the distal contralateral territory implicated in clinical studies of venous anatomy[6]. The synthetic values do not define adequate perfusion or a necrosis threshold, but they demonstrate why an aggregate flow or connectivity score cannot establish viability throughout a flap.
A candidate planning model should therefore report spatial flow distribution and the least-perfused tissue units alongside total throughput. Any proposed recruitment of additional supply or drainage would need to be evaluated for its effect on the vulnerable territory as well as on the sum of all flows. The negative regional Shapley contributions observed in some formulations further show that redistribution may disadvantage one territory while increasing whole-network throughput. Relating such patterns to viability will require regional perfusion measurements and information on tissue demand; neither oxygen delivery nor tissue injury is represented by the present steady-state flow values. Perfusion-area and volume estimates also depend on flap thickness and perforator geometry, supporting the need to represent tissue demand and spatial extent explicitly[1,2].
The single-segment analysis distinguishes local collateral resilience from common terminal vulnerability. Enhanced internal connectivity mitigated individual internal failures in the reference formulation, yet common arterial inflow and the only recipient venous outlet remained decisive. This distinction is more useful for future computational planning than labeling an entire mixed graph “N-1 secure”. Regional maps complement aggregate failure summaries by identifying uneven flow retention.
Model verification and physiological validation
The numerical checks show that the implemented equations are solved consistently: source inflow matches summed tissue exchange, internal nodes conserve flow, Shapley allocations recover the specified output difference, and conductance-preserving subdivision recovers the original reduced Laplacian. Alternative structures and conductance budgets additionally reveal which interpretations are sensitive to modeling choices. These checks establish computational consistency and characterize model behavior. Agreement among synthetic formulations cannot determine whether the selected conductances or compartmental responses reproduce human flap physiology.
Physiological validation must address that separate question. Conductance and exchange assumptions would first need calibration against measured geometry, pressures and regional perfusion, with uncertainty assigned to unresolved pathways. Predictions should then be evaluated in independent flaps or experimental conditions, including the regional response to a change in arterial supply or venous drainage. A reproducible or internally consistent prediction can still be physiologically inaccurate. Until such comparisons are available, the model supports mechanistic hypothesis testing and selection of measurements for validation; it does not establish a patient-specific perfusion threshold or an operative recommendation. Quantitative DIEP imaging studies and tissue-specific fluorescence reference curves provide candidate measurements for this calibration[11,12,18]; these dynamic signals would require an explicit observation model before comparison with steady-state network flow.
Implications for computational microsurgical planning
The immediate utility for computational microsurgical planning is to make the assumptions behind a proposed vascular arrangement explicit and test their consequences. Within a defined model, the surgeon can ask whether a planned outlet allows cross-midline drainage, whether an additional pathway improves the least-perfused territory, and whether a common terminal segment remains indispensable. These are conditional model comparisons. A credible patient-specific implementation should first specify arterial, tissue and venous compartments and the proposed anastomotic outlets. Imaging-derived vessel geometry would require segment-length and caliber measurements, while unresolved microvascular pathways would need uncertainty models calibrated against perfusion measurements. Anatomical co-registration and regional perfusion assessment would be essential; routine CTA alone cannot be assumed to resolve every relevant plexus or linking vessel. Recent automated CTA-based perforator mapping demonstrates a potential route to extracting patient-specific anatomy[19]. Its segmentation performance does not by itself validate a downstream perfusion model.
After physiological validation, clinical evaluation should assess defined outcomes separately, including venous congestion, objectively assessed fat necrosis, partial flap loss and reoperation. It should test added value over established anatomical and operative predictors and determine whether model-guided choices improve outcomes. The present framework provides reproducible model definitions and specific validation targets for that work. Its contribution is to identify when an apparent perfusion advantage depends on segmentation, drainage or spatial aggregation, thereby directing future validation toward the assumptions that could alter a surgical decision.
Limitations
All quantitative results arise from synthetic weights, positions and pathway budgets. Shapley shares allocate model changes and are not causal contributions to survival. Graph connectivity, capacity degradation and dimensionless tissue throughput are distinct outputs, none calibrated to oxygen delivery, necrosis or clinical decision thresholds. The structural and budget contrasts explore a limited design space and do not represent independent observations, anatomical frequencies or a validated physiological parameter range. Equalizing summed conductance controls one numerical budget while preserving differences in edge placement, number of segments and pathway function. Passive-network monotonicity partly determines the increase in total flow, limiting its value as an independent test of biological validity. The continuous analyses address selected conductance interactions but do not reproduce dynamic choke recruitment, autoregulation, vessel compliance, venous valves, thrombosis, edema or tissue oxygen consumption.
The spatial layouts are compartmental abstractions without measured perforasome geometry, flap thickness or tissue-demand heterogeneity. Sensitivity to segmentation is demonstrated analytically, but no patient-derived ground-truth graph is available to quantify the error of anatomical coarse-graining. Equal normalized venous outlet pressures are an assumption; recipient pressure differences and nonlinear resistance require future extensions. Uniform random deletion in the original capacity benchmark is not a biological failure process. The framework has not been calibrated to human DIEP perfusion or evaluated against independent physiological measurements or clinical outcomes.
Conclusion
Network-based DIEP perfusion modeling can identify the assumptions on which an apparent redundancy advantage depends. Raw λ2 is representation-dependent, the relative contribution of MCLV and SDC changes with available drainage, and whole-network throughput can conceal profound regional underperfusion. Internal collateral resilience also does not remove vulnerability at shared terminal vessels. These verified model behaviors provide a concrete basis for testing proposed vascular arrangements and designing physiological validation. Patient-specific perfusion estimates and clinical recommendations require calibration and independent validation against human measurements.
DECLARATIONS
Authors’ contributions
Made substantial contributions to the conception and design of the study: Wallner C, Fiedler A, Drysch M
Performed the graph modeling, computational analysis and interpretation: Wallner C, Fiedler A
Contributed to the surgical and anatomical interpretation: Wallner C, Schmidt S, Reinkemeier F, Puscz F, Lehnhardt M, Drysch M
Drafted the manuscript: Wallner C
All authors critically revised the manuscript for important intellectual content, and are accountable for the integrity of the work.
Availability of data and materials
All study data are synthetic. Complete graph specifications, executable analysis and figure scripts, full-precision numerical results, environment information and reproduction instructions are included in Supplementary Materials. The accompanying supplementary document provides the model definitions and supporting results. No patient-level dataset was analyzed.
AI and AI-assisted tools statement
During the preparation of this manuscript, the AI tool Google Gemini Deep Research and Anthropic Claude Opus (version 4.6, released 2026-02-05) supported the initial research and methodological review. OpenAI ChatGPT (version 5.2, released 2025-12-11) assisted with literature checks, code review, manuscript editing and figure preparation. AI-assisted figure preparation covered Figures 1-4, Supplementary Figures 1 and 2, and the Graphical Abstract, including assistance in creating individual components and plotting code. The authors assembled and edited these components in Adobe Illustrator 2026 (version 30.1, released 2026-02). The quantitative plots and network representations derive from the accompanying executable Python analyses and model specifications, rather than AI-estimated numerical values. The tools did not influence the study design, data collection, analysis, interpretation, or the scientific content of the work. All authors take full responsibility for the accuracy, integrity, and final content of the manuscript.
Financial support and sponsorship
None.
Conflicts of interest
All authors declared that there are no conflicts of interest.
Ethical approval and consent to participate
Not applicable.
Consent for publication
Not applicable.
Copyright
© The Author(s) 2026.
Supplementary Materials
REFERENCES
1. Park JW, Kang JM, Yoo K, Woo KJ. Perfusion area versus volume of the DIEP flap: a multivariable analysis of perforator and flap characteristics for estimation of perfusion area and volume. J Plast Reconstr Aesthet Surg. 2024;96:215-22.
2. Suhail D, Faderani R, Mosahebi A, Akali A. Perforator-related risk factors for perfusion-related complications in DIEP Flap breast reconstruction. JPRAS Open. 2025;44:390-401.
3. Saint-Cyr M, Wong C, Schaverien M, Mojallal A, Rohrich RJ. The perforasome theory: vascular anatomy and clinical implications. Plast Reconstr Surg. 2009;124:1529-44.
4. Taylor GI, Corlett RJ, Ashton MW. The functional angiosome: clinical implications of the anatomical concept. Plast Reconstr Surg. 2017;140:721-33.
5. Schaverien M, Saint-Cyr M, Arbique G, Brown SA. Arterial and venous anatomies of the deep inferior epigastric perforator and superficial inferior epigastric artery flaps. Plast Reconstr Surg. 2008;121:1909-19.
6. Sowa Y, Kodama T, Fujikawa K, Morita D, Numajiri T, Sakaguchi K. The influence of venous system patterns on DIEP flap viability for breast reconstruction. J Plast Surg Hand Surg. 2021;55:361-7.
7. Paganini F, Matarazzo S, Corsini B, et al. Superficial vs. deep venous system in DIEP flaps: lessons from 25 years of CTA-guided planning. J Clin Med. 2025;14:5972.
8. Varnava C, Wiebringhaus P, Kampshoff D, Hirsch T, Kueckelhaus M. Use of the superficial inferior epigastric vein in breast reconstruction with a deep inferior epigastric artery perforator flap. Front Surg. 2023;10:1050172.
9. Zhu Y, Yoo H, Min S, Chang H. Efficacy of superficial inferior epigastric vein superdrainage in free TRAM and DIEP flap: an indocyanine green angiography study of 68 cases. J Plast Reconstr Aesthet Surg. 2023;84:385-91.
10. Kramer A, Lava CX, Li KR, Berger LE, Khayat E, Song DH. Indocyanine green angiography for detecting quantitative perfusion changes in deep inferior epigastric perforator flap breast reconstruction with second venous drainage. Ann Plast Surg. 2024;93:215-20.
11. Kleiss SF, Michi M, Schuurman SN, de Vries JPPM, Werker PMN, de Jongh SJ. Tissue perfusion in DIEP flaps using Indocyanine Green Fluorescence Angiography, Hyperspectral imaging, and Thermal imaging. JPRAS Open. 2024;41:61-74.
12. Zötterman J, Tesselaar E, Elawa S, Elmasry M, Farnebo S. Perfusion mapping of flaps using indocyanine green fluorescence angiography and laser speckle contrast imaging. last Reconstr Surg Glob Open. 2024;12:e5964.
14. Dorfler F, Bullo F. Kron reduction of graphs with applications to electrical networks. IEEE Trans Circuits Syst I. 2013;60:150-63.
15. Tyree MT, Sperry JS. Do woody plants operate near the point of catastrophic xylem dysfunction caused by dynamic water stress?: answers from a model. Plant Physiol. 1988;88:574-80.
16. Shapley LS. 17. A value for n-person games. In: Kuhn HW, Tucker AW, Editors. Contributions to the Theory of Games, Volume II. Princeton University Press; 1953. pp. 307-17.
18. Tange FP, Peul RC, van den Hoven P, et al. Establishing reference curves for vital tissue perfusion using quantitative near-infrared fluorescence imaging with indocyanine green. Langenbecks Arch Surg. 2025;410:28.
Cite This Article
 Open Access
How to Cite
Download Citation
Export Citation File:
Type of Import
Tips on Downloading Citation
Citation Manager File Format
Type of Import
Direct Import: When the Direct Import option is selected (the default state), a dialogue box will give you the option to Save or Open the downloaded citation data. Choosing Open will either launch your citation manager or give you a choice of applications with which to use the metadata. The Save option saves the file locally for later use.
Indirect Import: When the Indirect Import option is selected, the metadata is displayed and may be copied and pasted as needed.
About This Article
Copyright

Data & Comments
Data
0






Comments
Comments must be written in English. Spam, offensive content, impersonation, and private information will not be permitted. If any comment is reported and identified as inappropriate content by OAE staff, the comment will be removed without notice. If you have any queries or need any help, please contact us at support@oaepublish.com.