



fig2
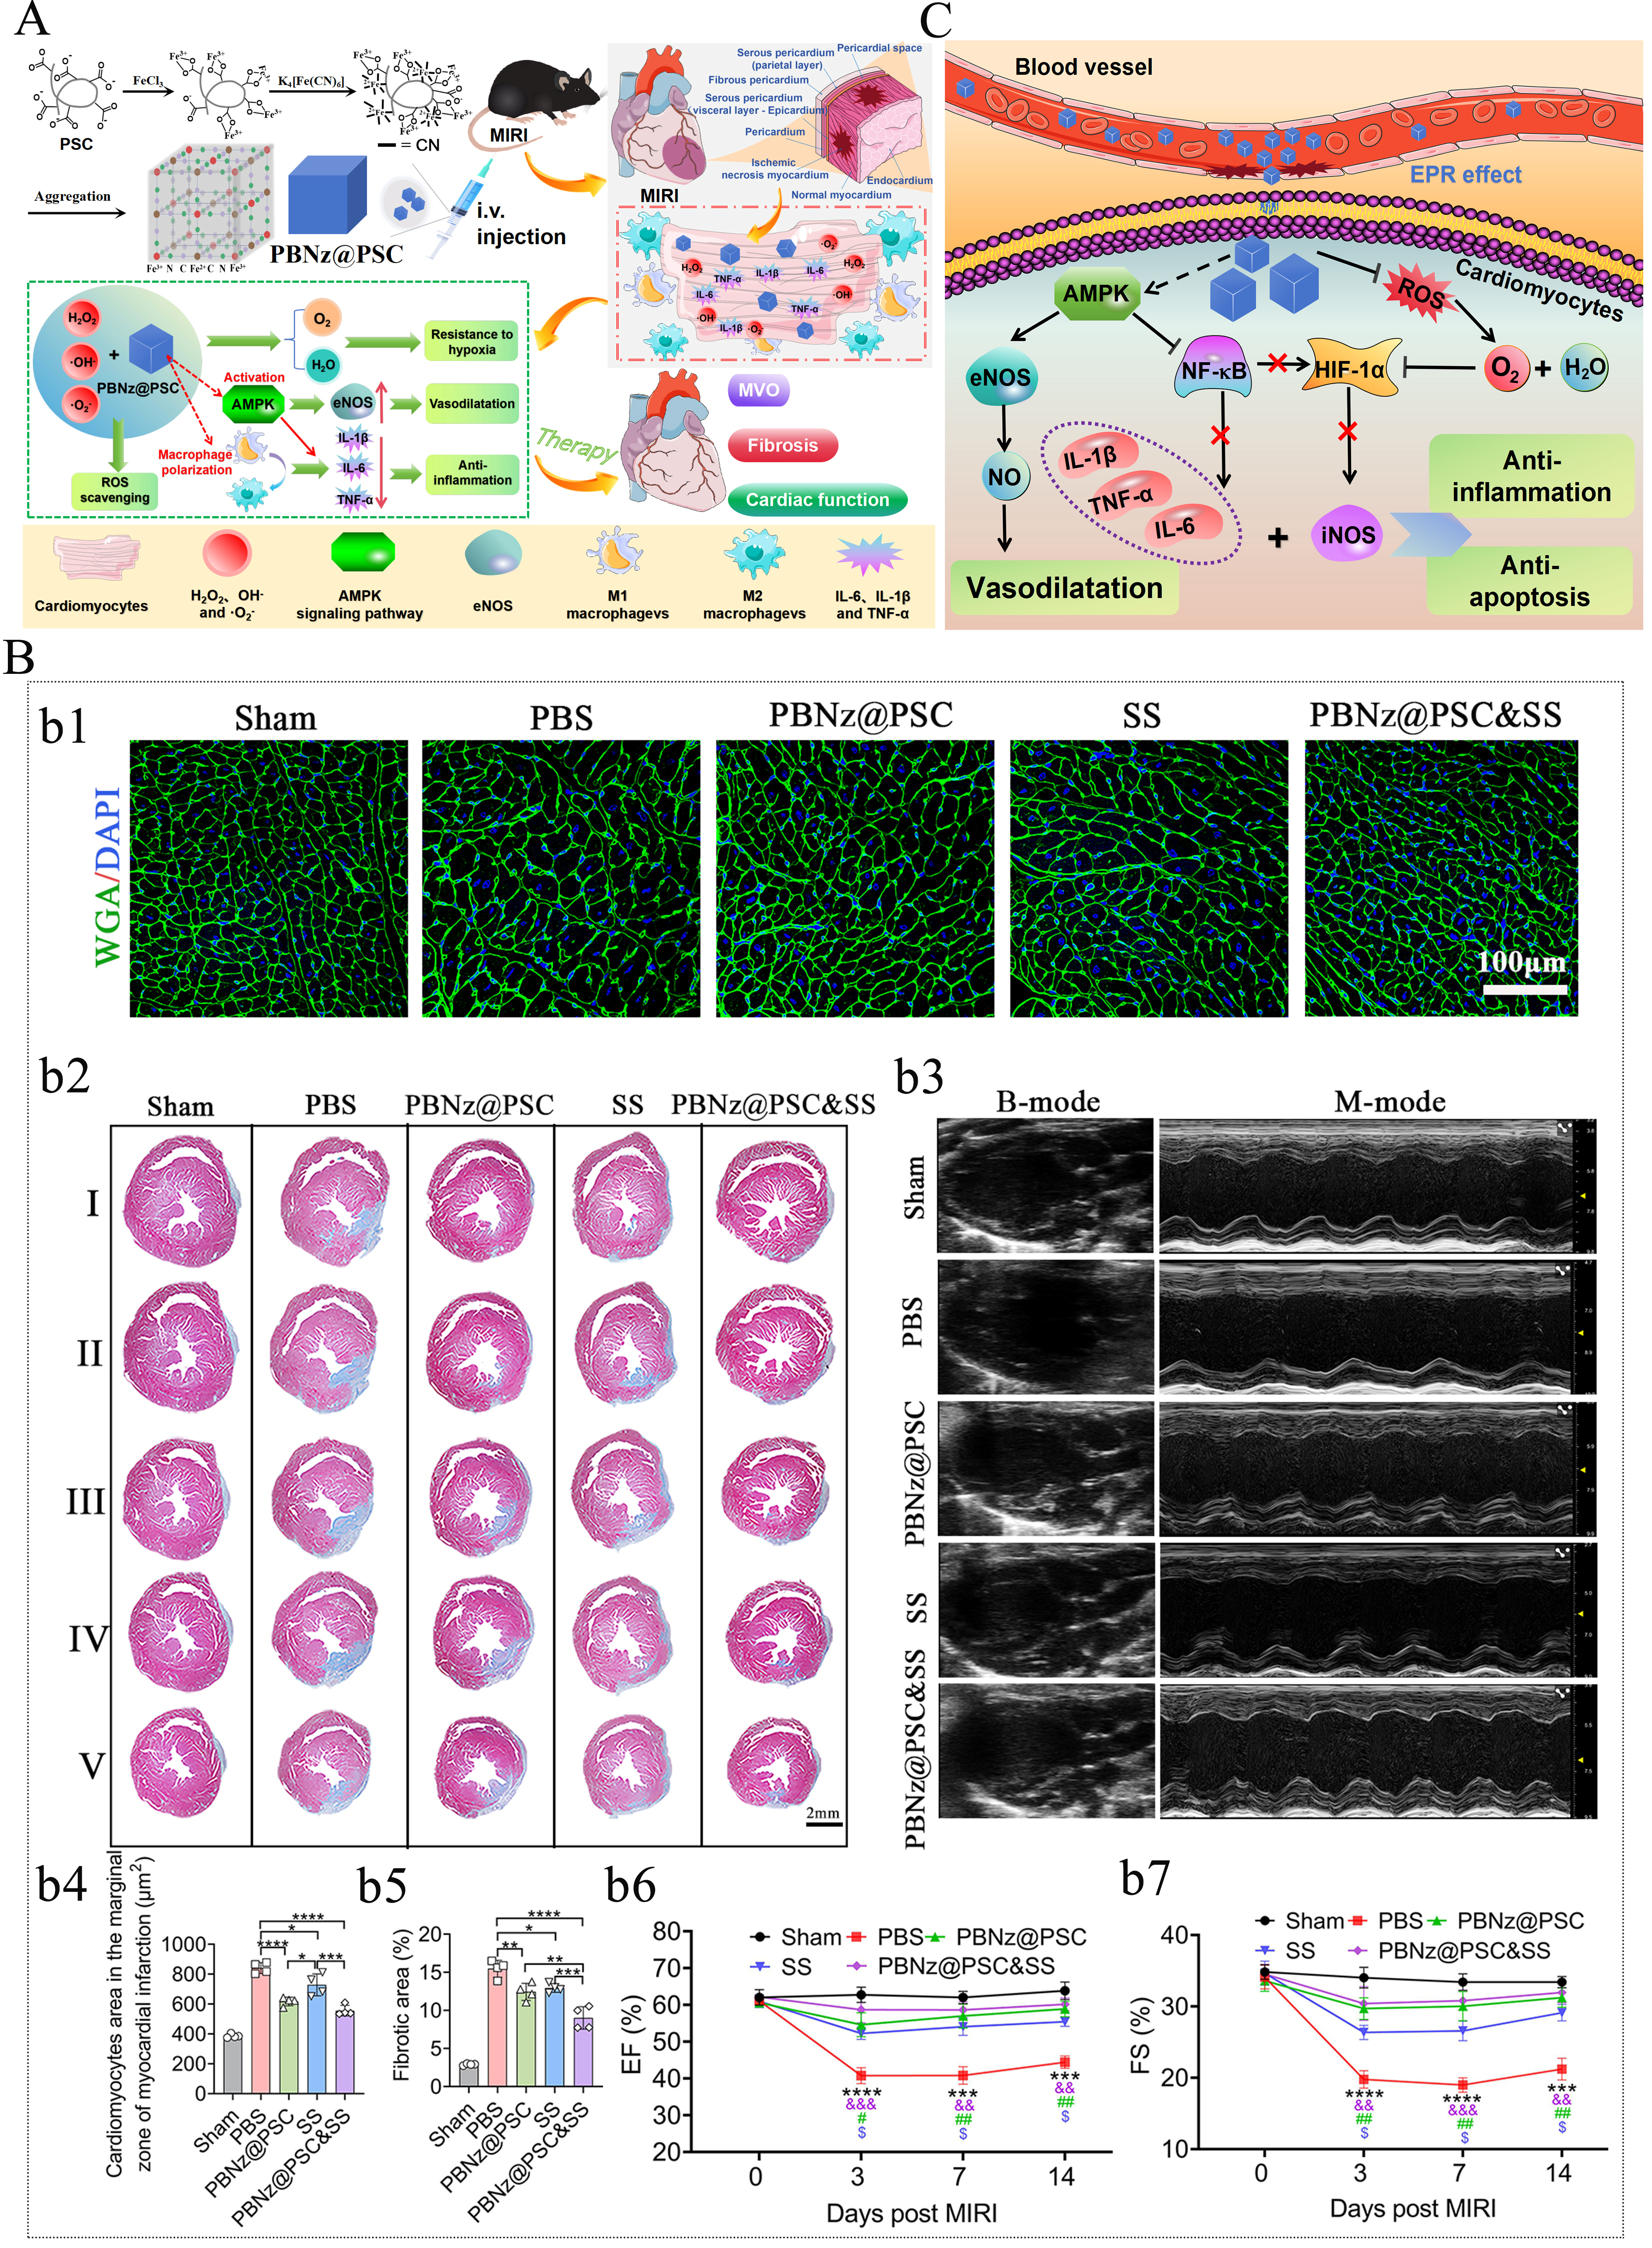
Figure 2. PBNZ@PSC used for the treatment of MIRI. (A) The schematic diagram of the preparation process of PBNZ@PSC and its application in MIRI treatment; (B) The schematic diagram illustrating the possible mechanism of PBNZ@PSC in MIRI treatment; (C) The therapeutic effect of PBNZ@PSC on MIRI. This figure is quoted with permission from Mengmeng Long et al.[17]. Here, * indicates sham vs. PBS, & indicates PBNz@PSC and SS vs. PBS, # indicates PBNz@PSC vs. PBS, and $ indicates SS vs. PBS. Data are presented as mean ± SD, *P ≤ 0.05, **P ≤ 0.01, ***P ≤ 0.001, ****P ≤ 0.0001, &&P ≤ 0.01, &&&P ≤ 0.001, #P ≤ 0.05, ##P ≤ 0.01, and $P ≤ 0.05.