

fig5
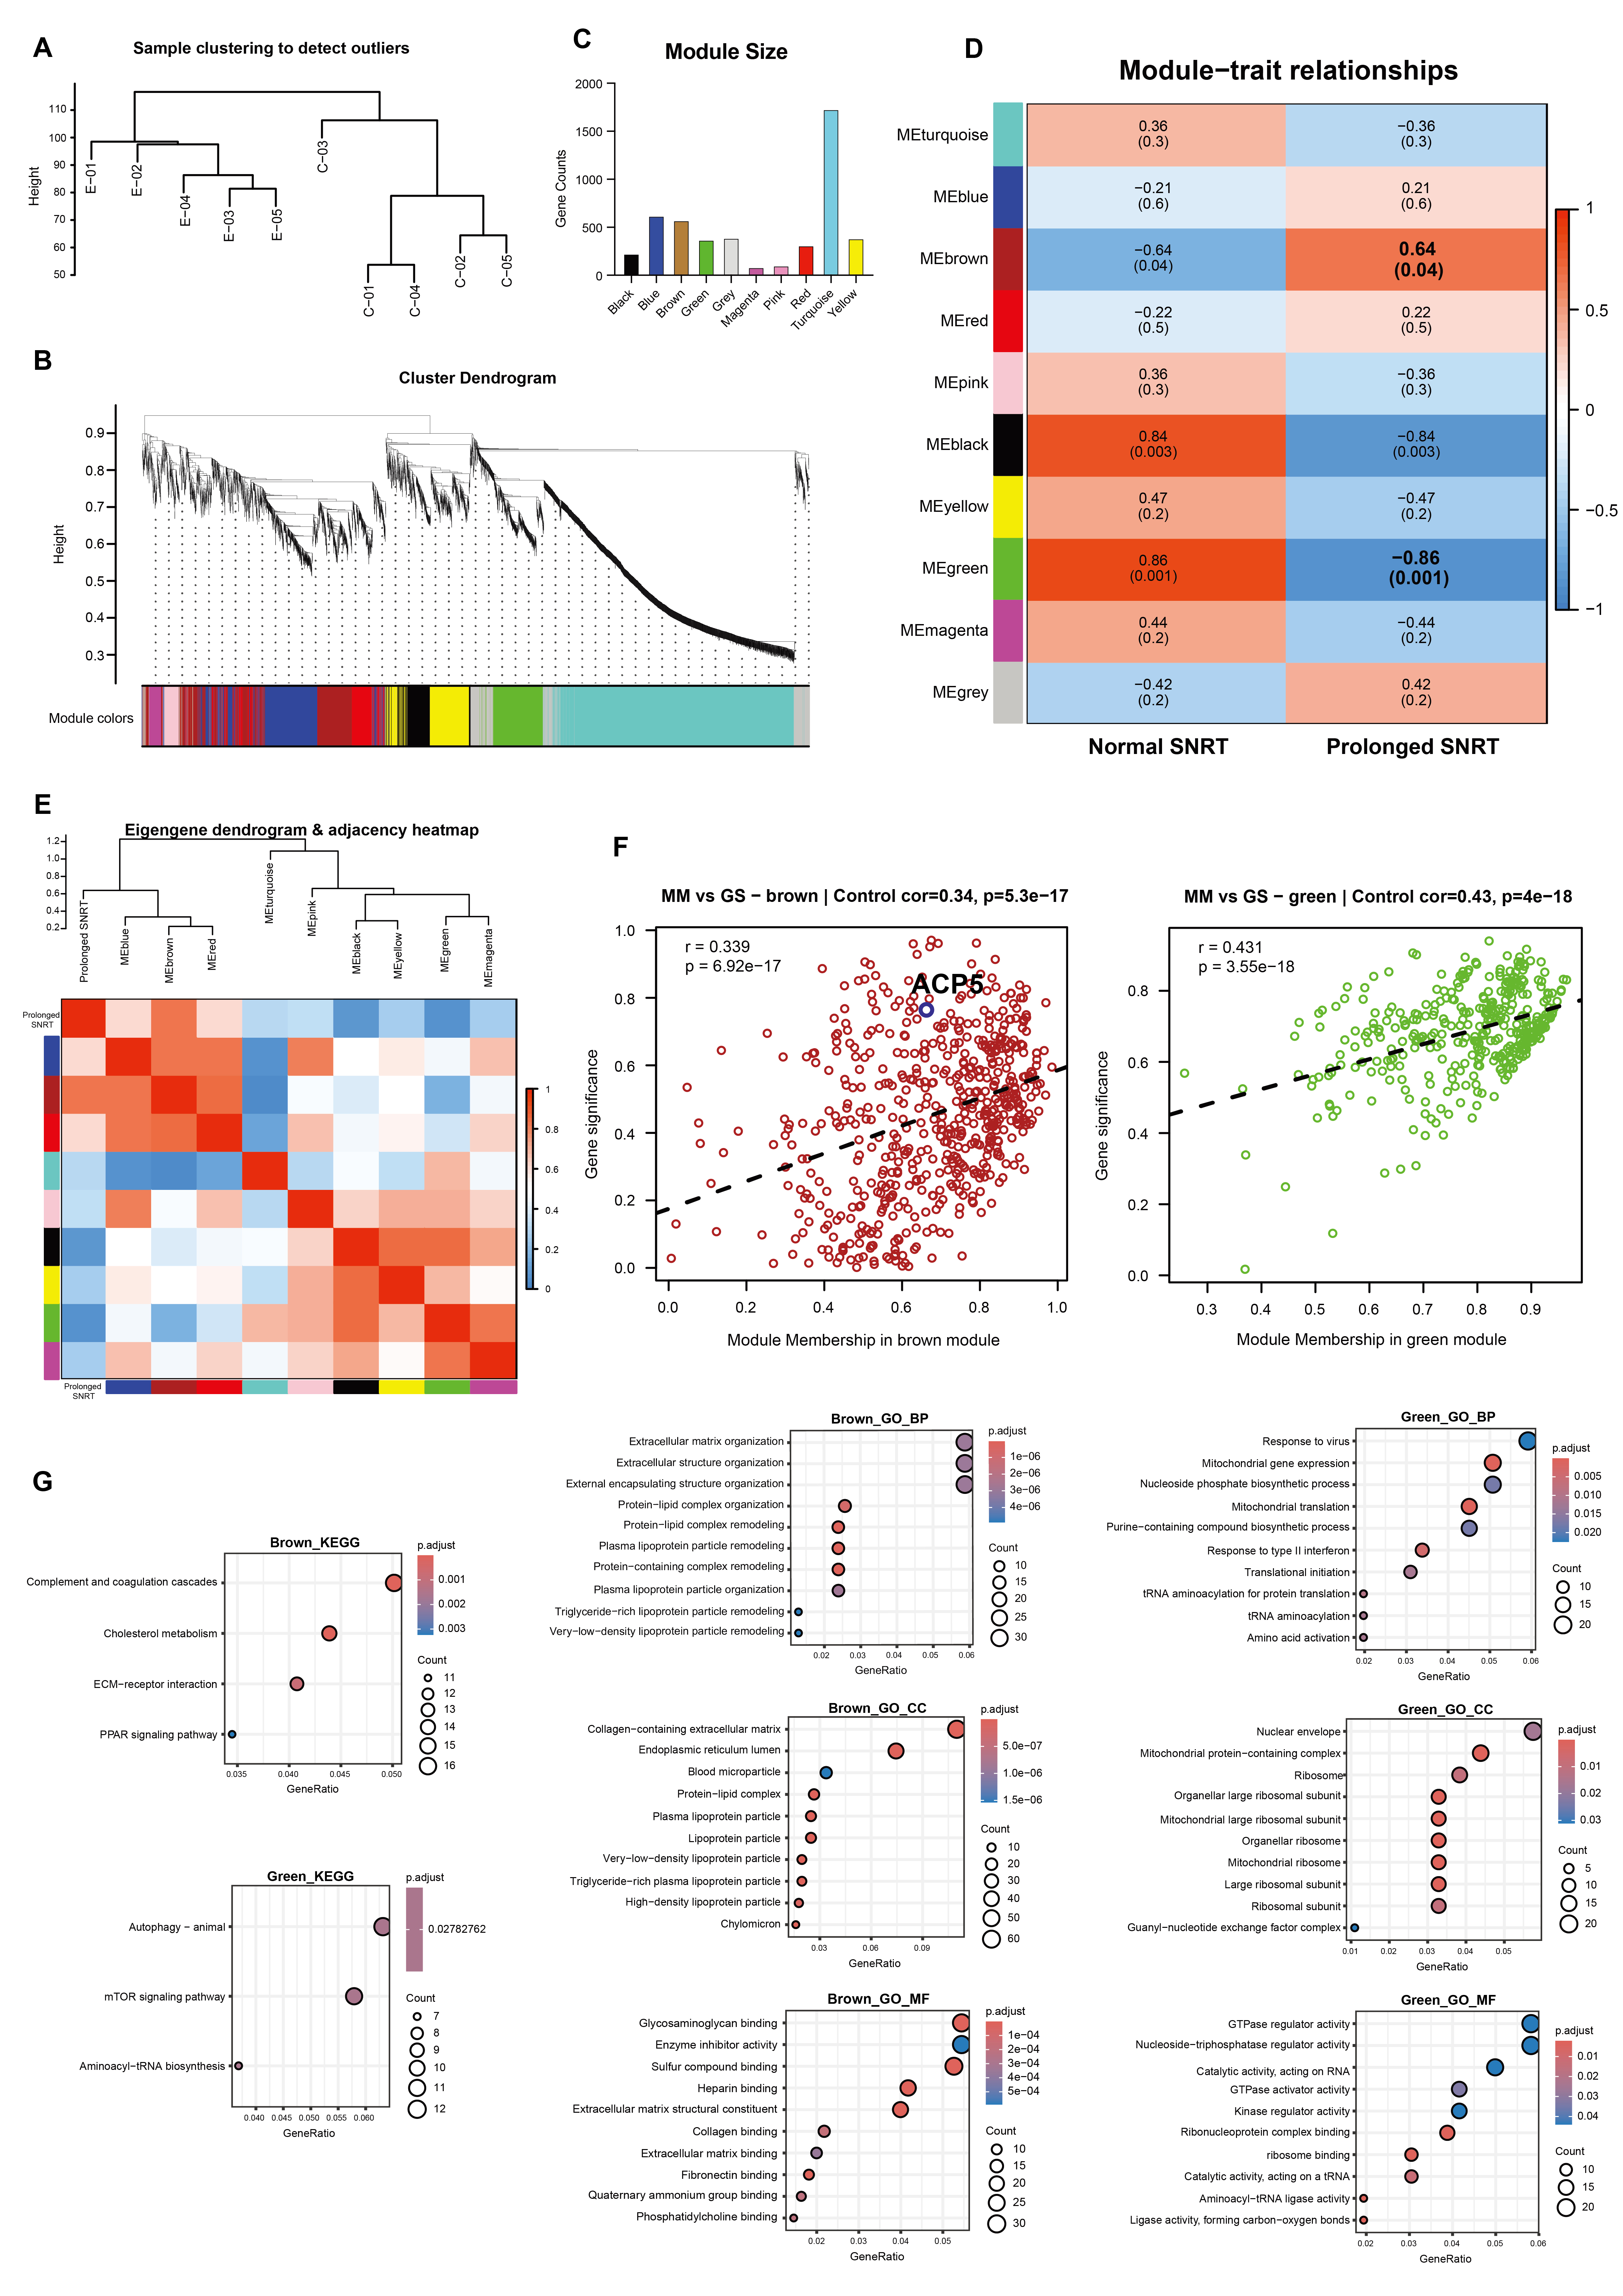
Figure 5. Weighted protein co-expression network analysis (WGCNA) and functional characterization of key modules. (A) Sample clustering dendrogram of all proteomic samples before network construction, showing no apparent outliers. (B) Cluster dendrogram of proteins with module color assignment. (C) Bar plot summarizing the number of proteins assigned to each co-expression module, with colors representing module identities. (D) Heatmap of module-trait correlations illustrating Pearson coefficients between module eigengenes and the prolonged-SNRT phenotype (prolonged vs. normal SNRT). (E) Eigengene dendrogram and adjacency heatmap showing relationships among module eigengenes. (F) Scatterplots illustrating the relationship between module membership (MM) and gene significance (GS) for the brown and green modules. Each dot represents a protein, and positive correlations indicate that highly connected proteins are closely associated with the phenotype. (G) GO and KEGG enrichment analyses of the brown and green modules, highlighting the top-enriched biological processes, cellular components, molecular functions, and pathways relevant to the prolonged-SNRT phenotype.