



fig4
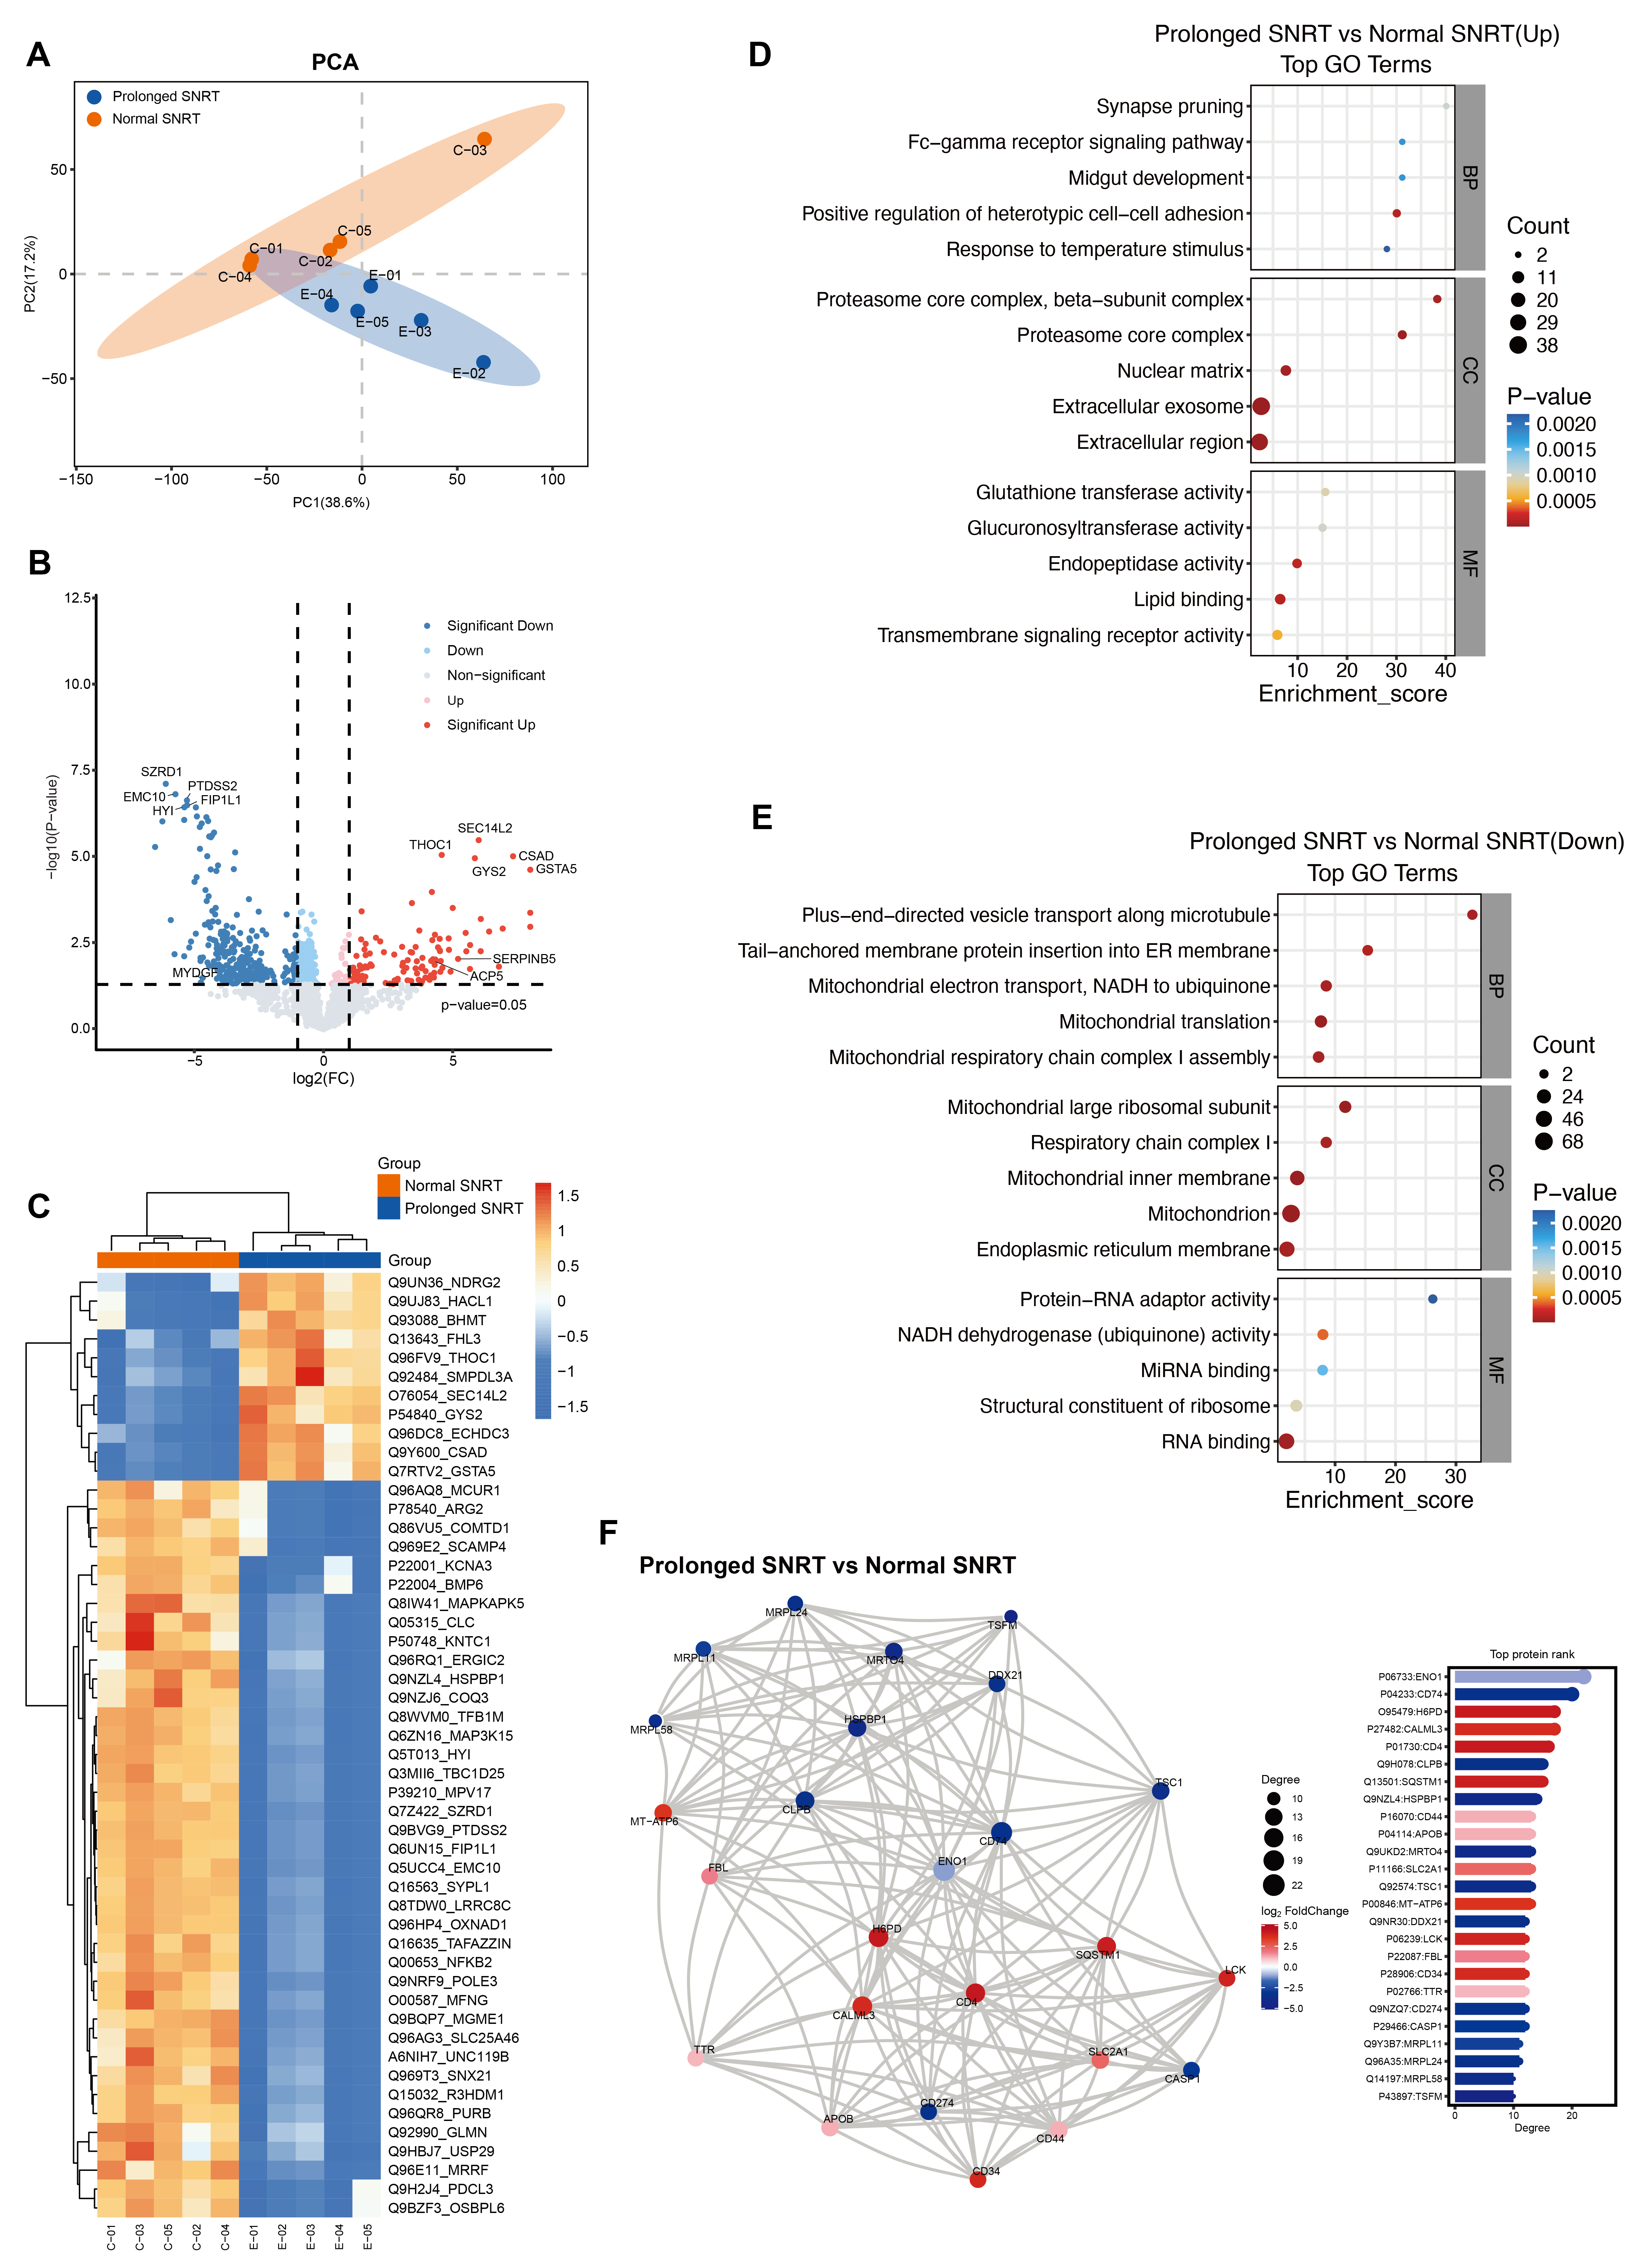
Figure 4. Proteomic profiling reveals distinct molecular signatures between the prolonged-SNRT and normal-SNRT groups. (A) Principal component analysis (PCA) showing clear separation between prolonged-SNRT and normal-SNRT samples. (B) Volcano plot showing significantly upregulated and downregulated proteins between the two groups. (C) Heatmap of the top 50 DEPs demonstrating distinct group-specific expression patterns. (D) Gene ontology (GO) enrichment analysis summarizing the main biological processes associated with upregulated DEPs. (E) GO enrichment analysis summarizing the main biological processes associated with downregulated DEPs. (F) Protein-protein interaction (PPI) network visualizing the interaction landscape among DEPs. DEPs were defined as those with |log₂ fold change| > 1 and P < 0.05.