


fig2
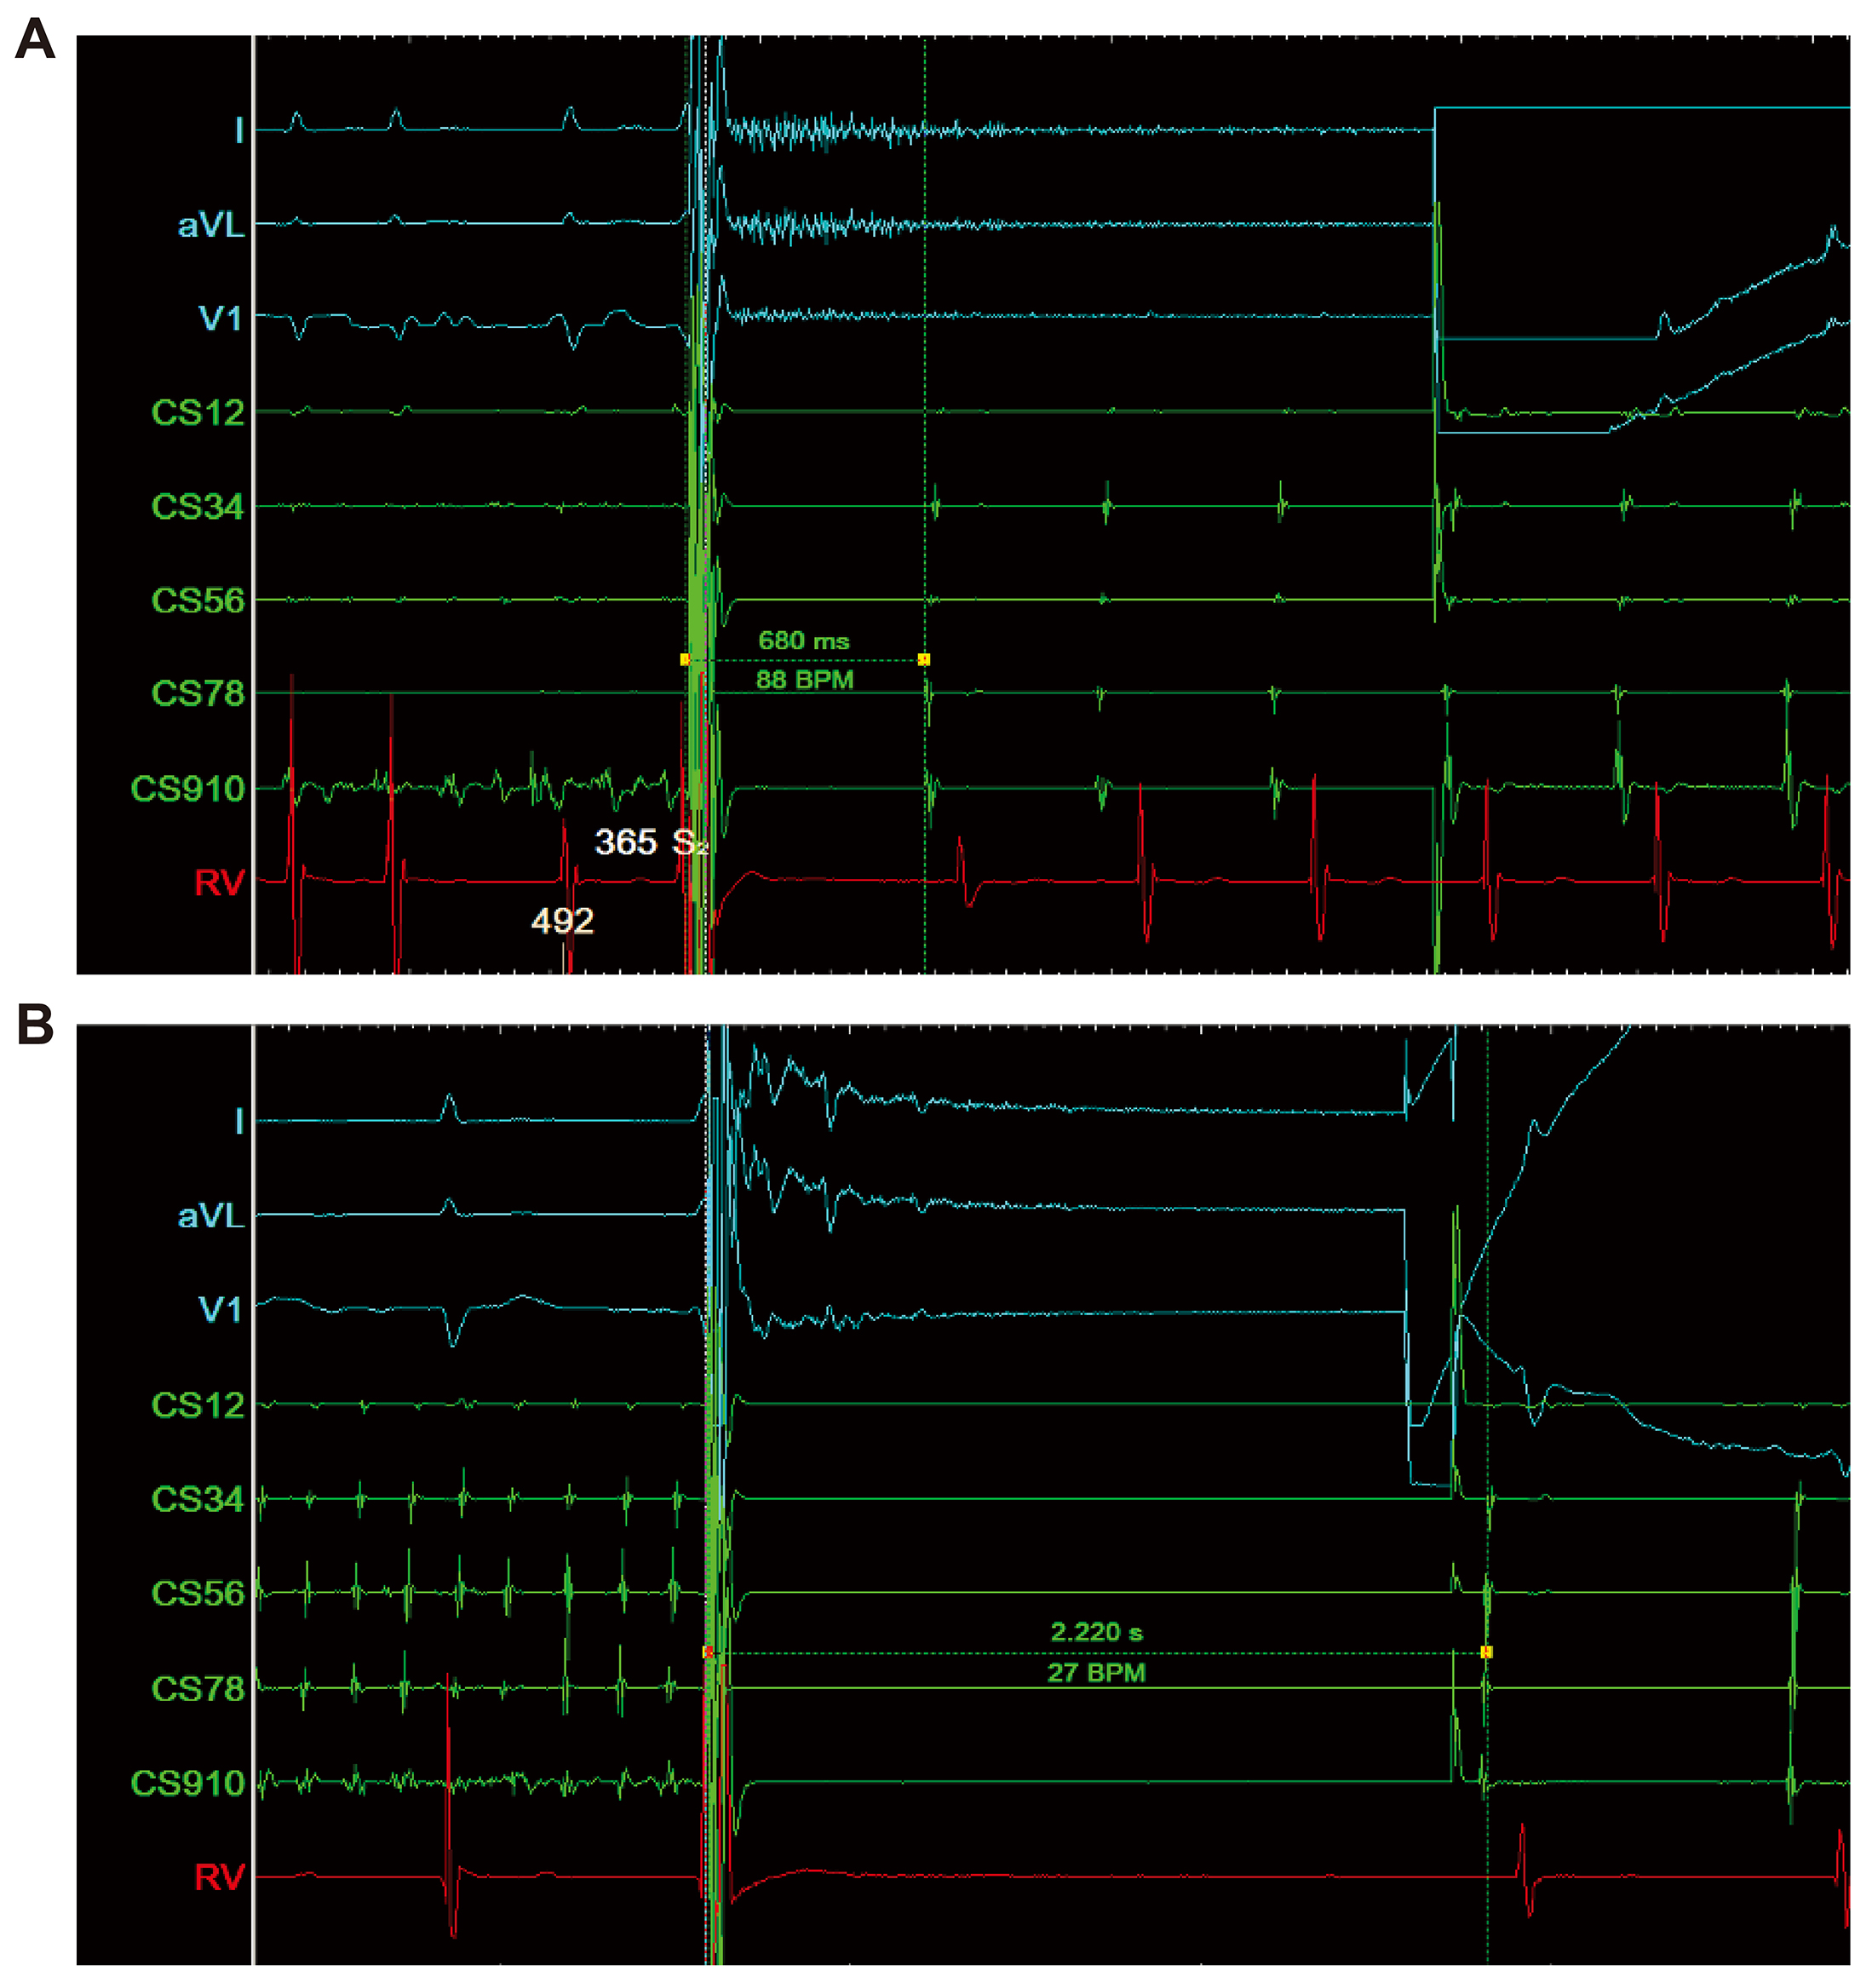
Figure 2. Intracardiac electrograms showing normal (A) and prolonged (B) sinus node recovery times (SNRT) after electrical cardioversion. (A) Example of normal sinus node recovery following direct current cardioversion. The first spontaneous sinus P wave appeared 680 ms after the cardioversion shock. (B) Example of delayed sinus node recovery after cardioversion. The first sinus P wave appeared 2.22 s after the shock. CS: coronary sinus electrograms recorded from proximal (CS12) to distal (CS910) poles; I: aVL, V1, surface ECG leads; RV: right ventricular channel.